FXON services will be temporarily suspended due to phased system upgrades and a platform redesign. As functions will be restricted in stages, we kindly ask that you close open positions and withdraw your account funds by March 31. (Details here)
FXON services will be temporarily suspended due to a full platform redesign. We kindly ask that you close open positions and withdraw your account funds by March 31. (Details here)
What can be checked in the "Graph" section of the Performance screen?
Performance Check
This article was :
Published in 2024.05.14
Updated in 2026.01.07
The performance page gives you a graphical view of your FXON account balance or profit/loss. Use this to check and manage your portfolio. It is also possible to hide unnecessary items.
For details and calculation formulas, please see the table below.
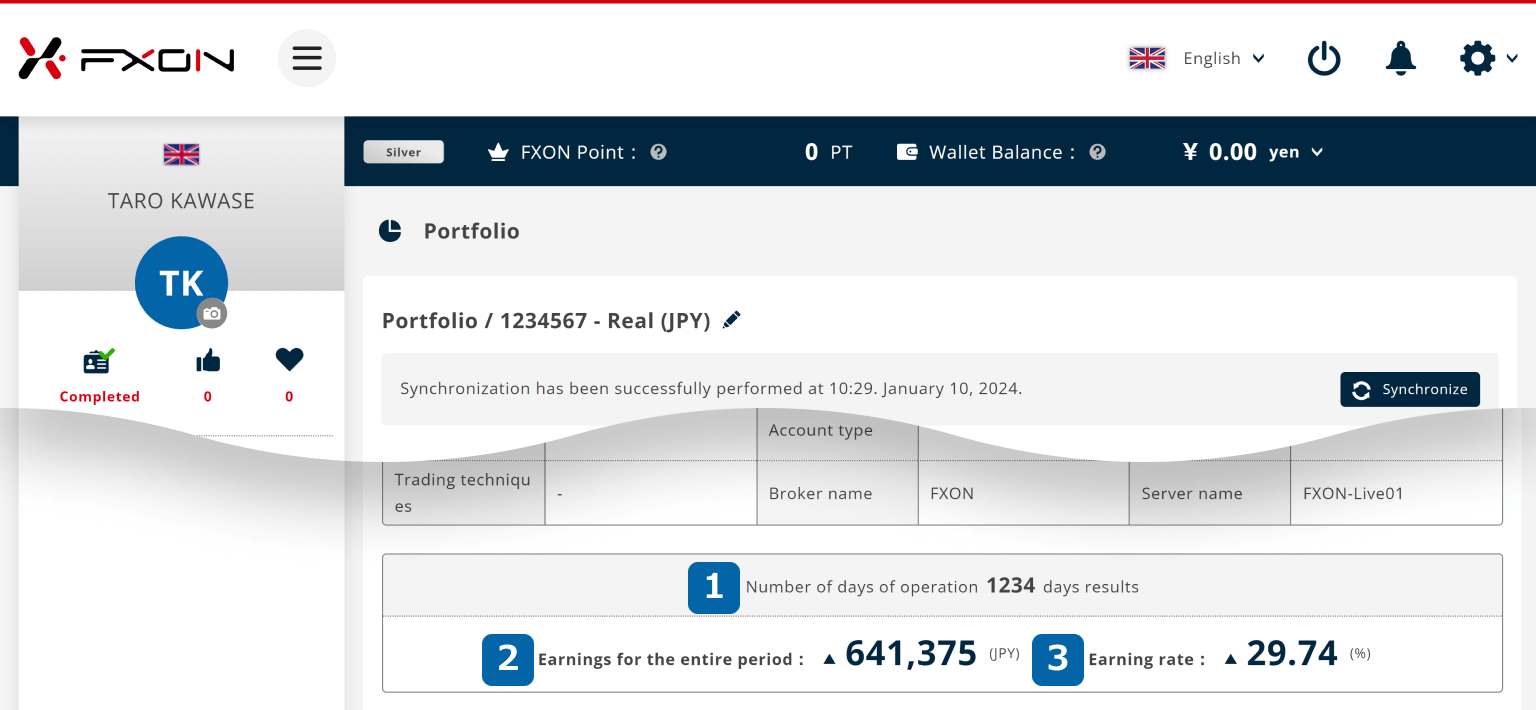
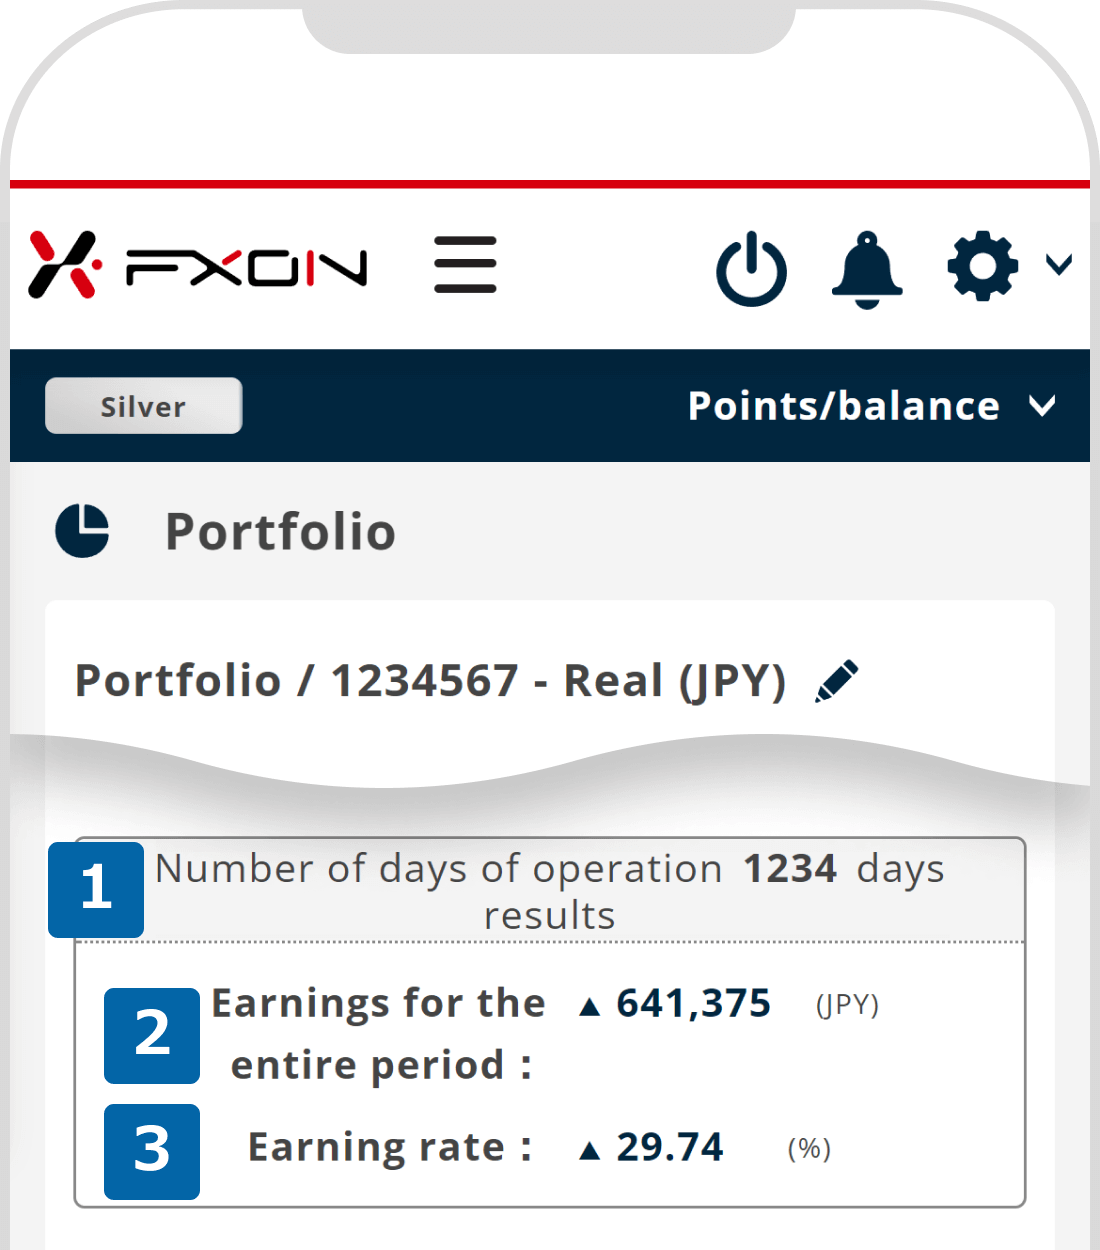
Duration and earnings
This section shows the number of days and earnings. See below for details on each item.
① Duration
Number of days since your account opening.
② Profit amount
It displays the total of confirmed profits for the entire period + Unrealized P/L. The blue ▲ indicates profit and the red indicates loss.
③ Rate of return
Rate of return for the entire period. (Confirmed profits for the entire period + Unrealized P/L) ÷ (Total cash deposits + Total credit deposits) × 100(%).
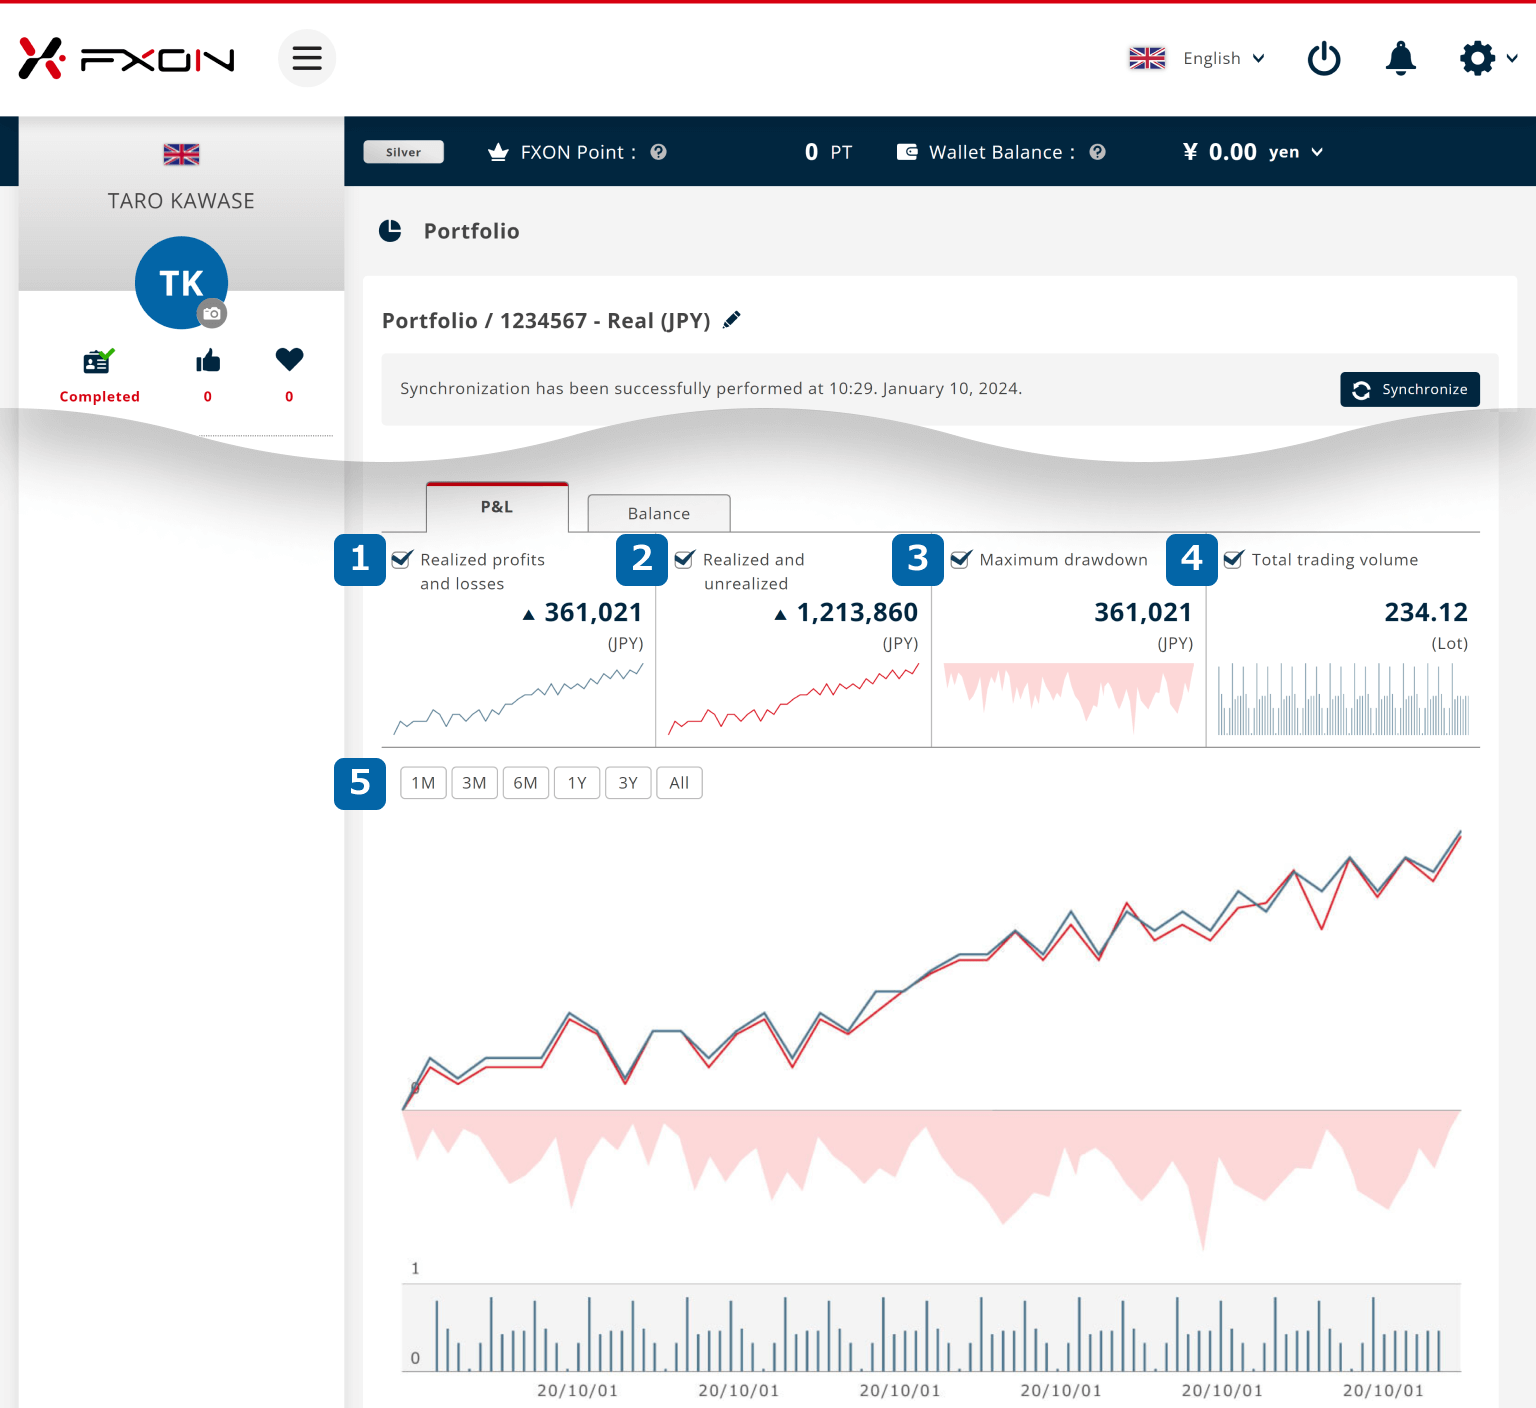
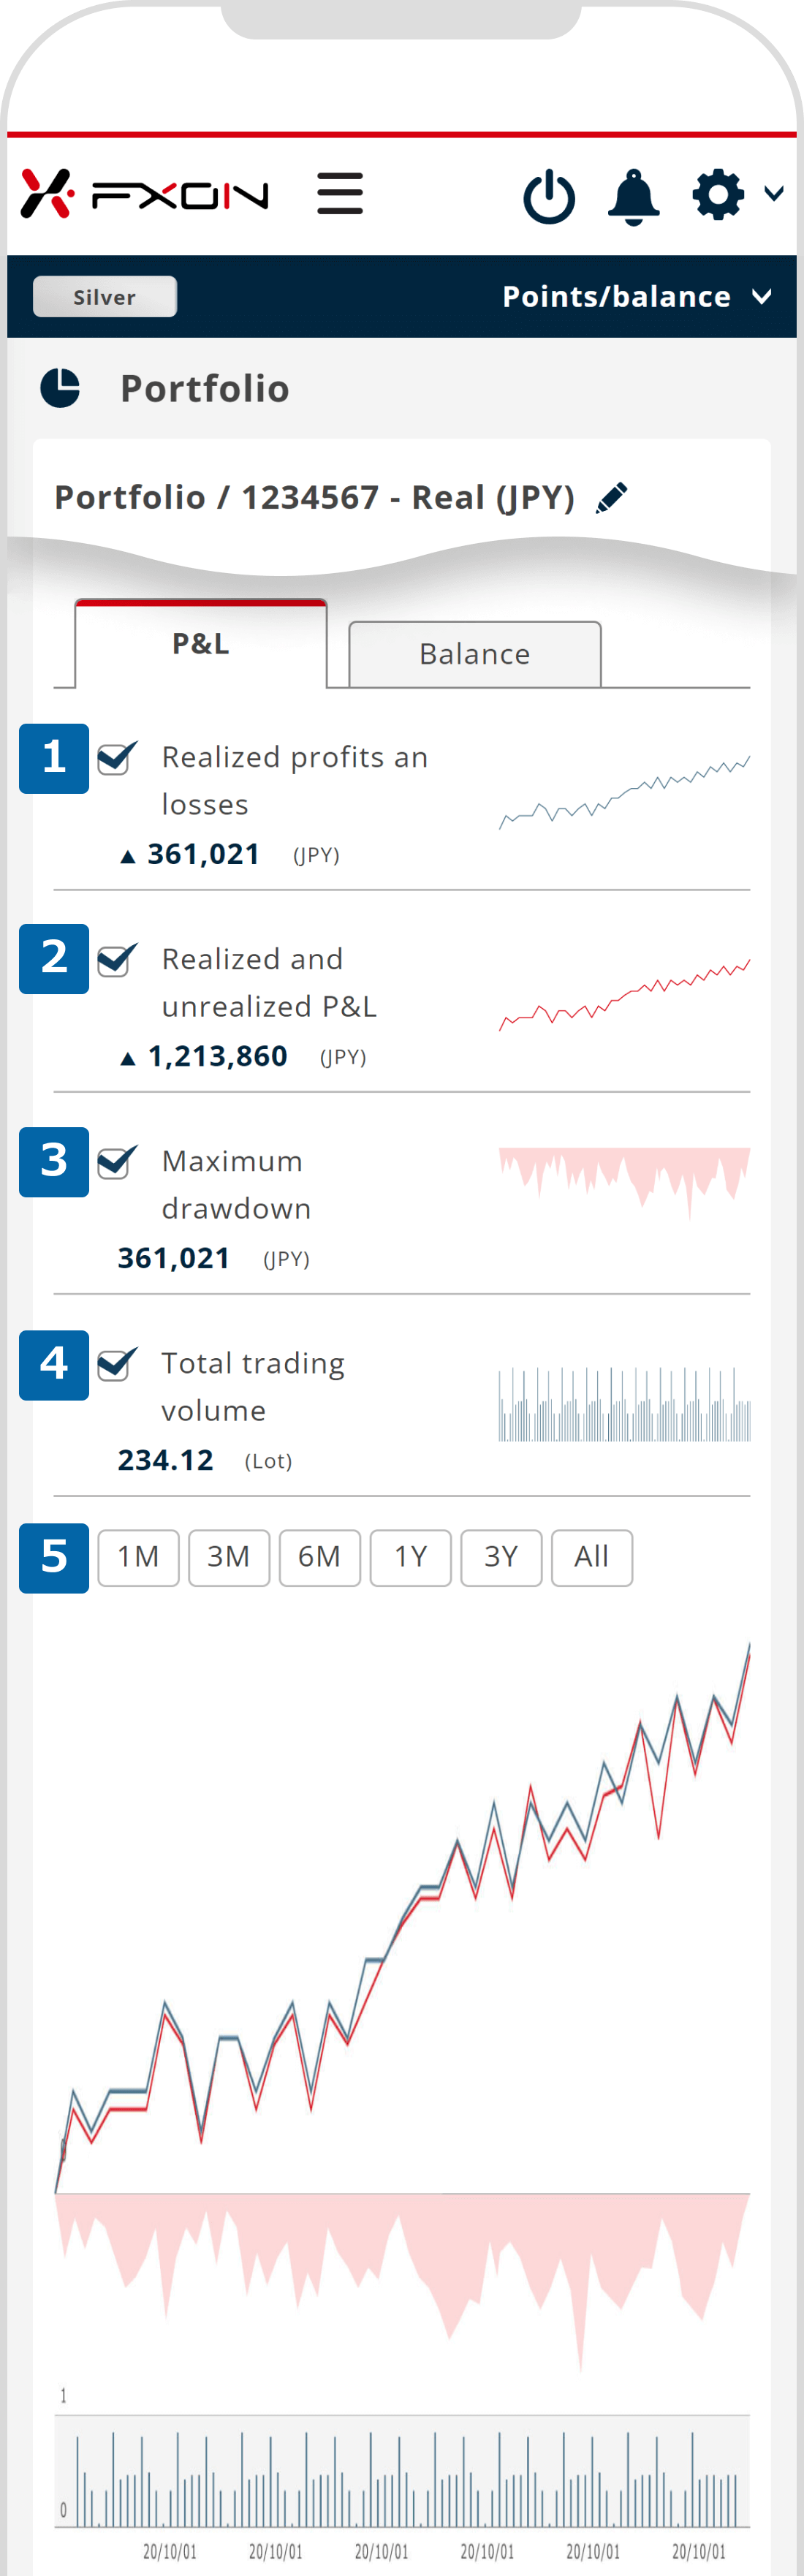
P&L chart
See below for details on each item. You can hide an item by unchecking its box.
Please refer to the details of each item below. You can display the next item by tapping the "<" on the left edge of the screen or the ">" on the right edge. Also, you can hide any item by turning off its toggle button.
① Realized profits and losses
The profit or loss that occurs when positions are closed, represented by a blue line graph. The text will be blue and the triangle will be up-pointing if positive, and red and down-pointing if negative.
② Realized and unrealized P&L
The profit or loss calculated based on the market value of your open positions, represented by a red line graph. The text will be blue and the triangle will be up-pointing if positive, and red and down-pointing if negative.
③ Maximum drawdown
The maximum drawdown in asset value from the peak to the lowest point.
④ Total trading volume
The total number of lots traded represented by a bar graph.
⑤ Select range
Choose the preferred range to be displayed on the chart between 1M (1 month) and 3Y (3 years). It is set to ALL (the entire period) by default.
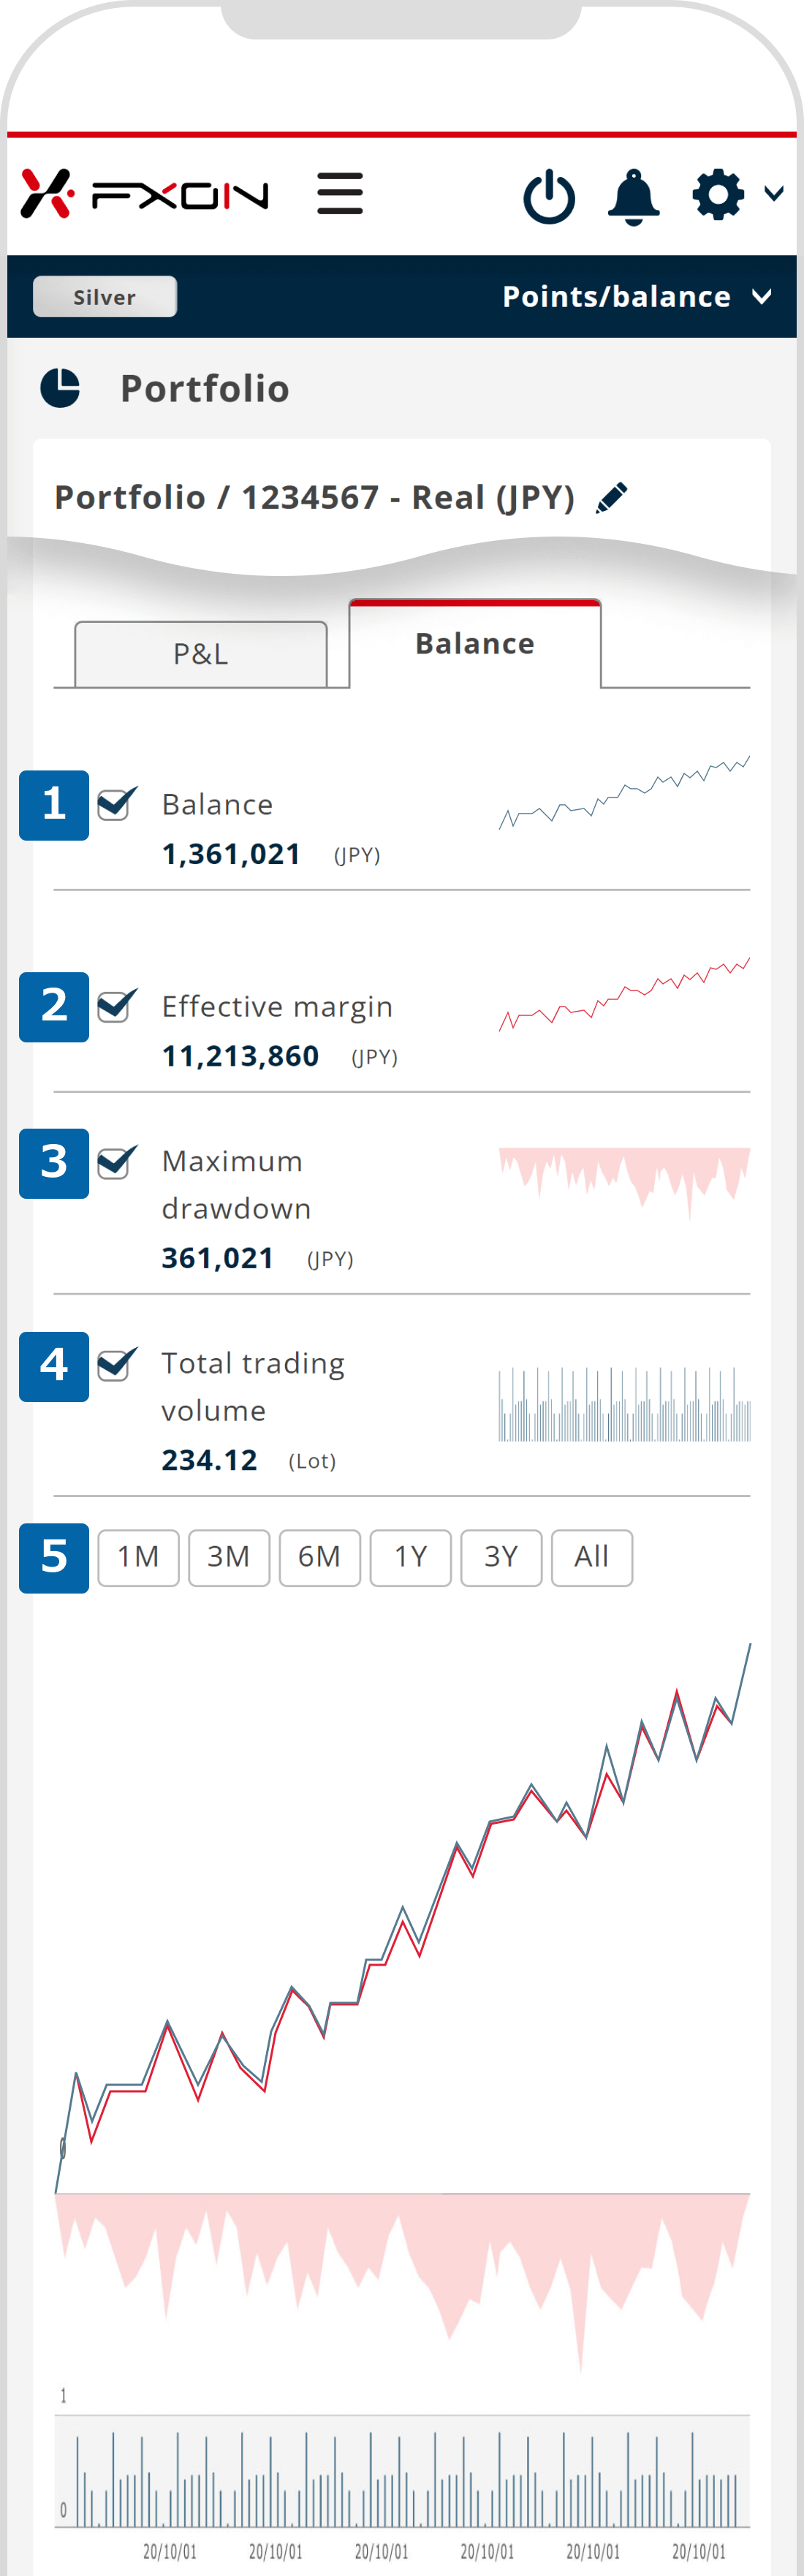
Balance chart
The balance chart visualizes the balance and trade size for each trading account. Use it to check the funds available in your account. You can hide an item by unchecking its box.
The portfolio balance screen displays the balance and trading volume for each trading account. Use this information to check the available funds within each account. You can view the next item by tapping the "<" icon on the left edge or the ">" icon on the right edge of the screen. To hide a specific item, simply turn off its toggle button.
① Balance
The blue line graph. When you deposit, withdraw, or close a position, the profit or loss is reflected in the balance.
② Effective margin
A red line graph. Balance plus floating P/L of open positions.
③ Maximum drawdown
The maximum amount from the peak of the highest profit to the bottom.
④ Total trading volume
The total number of lots traded represented by a bar graph.
⑤ Select range
Choose the preferred range between 1M (1 month) and 3Y (3 years). It is set to ALL (the entire period) by default.
Key Point
For details on the 'Trading Account Information,' and 'Trade Statistics' on the Performance screen, please refer to the FAQ below.
For details on the 'Trading Account Information,' and 'Trade Statistics' on the Performance screen, please refer to the FAQ below.