FXON services will be temporarily suspended due to phased system upgrades and a platform redesign. As functions will be restricted in stages, we kindly ask that you close open positions and withdraw your account funds by March 31. (Details here)
FXON services will be temporarily suspended due to a full platform redesign. We kindly ask that you close open positions and withdraw your account funds by March 31. (Details here)
What information about trading accounts and trade statistics can be checked on the performance screen?
Performance Check
This article was :
Published in 2024.05.14
Updated in 2026.01.08
The trading account information and trade statistics on the Performance screen provide a comparative analysis of the account margin status and aggregated trade performance with a graph of risk-reward ratios.
Please utilize the statistical data for your future trading. Please note that only closed positions are subject to counting in the trade statistics, and the open positions are not included.
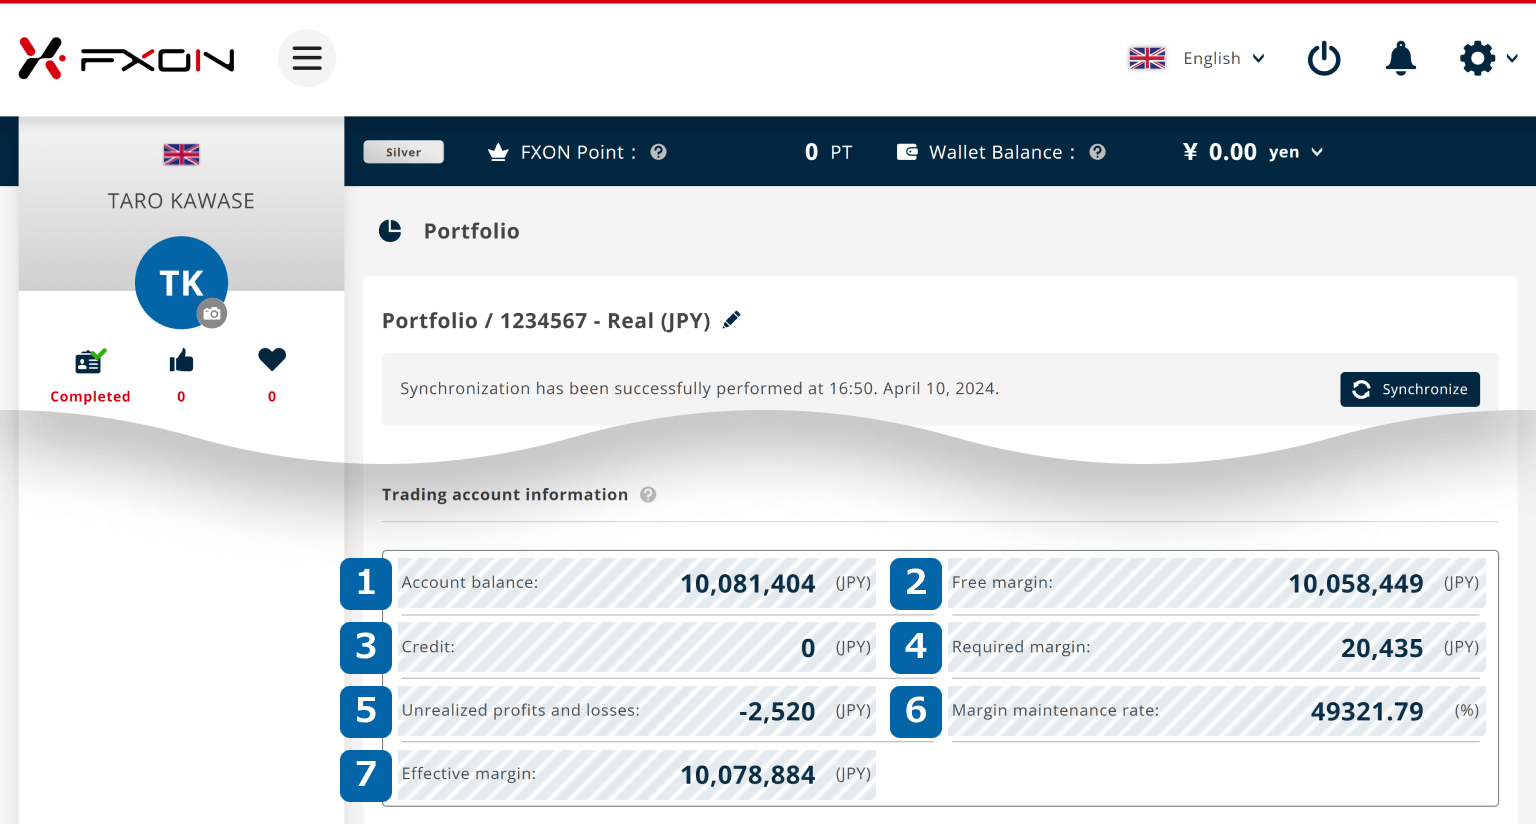
Trading account information
In the trading account information, the amount is shown including unrealized gains/losses in positions held. Please refer to the following for the definitions and calculation methods of each margin.
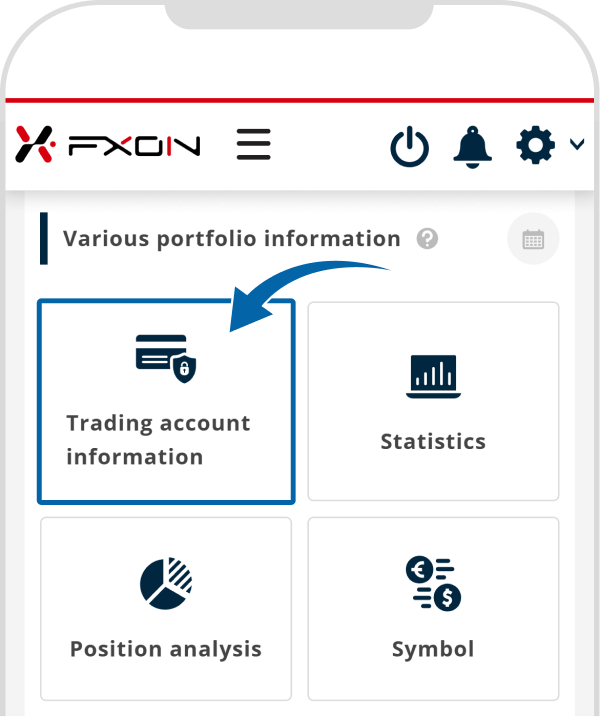
STEP 1
Tap "Trading account information"
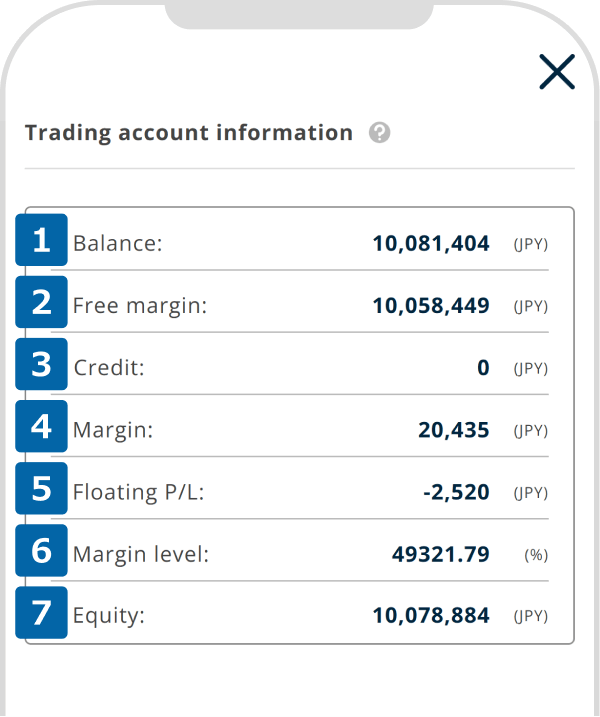
STEP 2
Trading account information details are displayed
① Balance
When you deposit, withdraw, or close a position, your profit or loss is reflected in your balance. It is not deducted at the time you hold a position. Balance = deposits + realized profit
② Free Margin
It is the amount after subtracting the required margin from the effective margin. Free margin = effective margin - required margin
③ Credit
Bonuses are added to credits. It cannot be withdrawn but can be used as margin. If there is a remaining balance, the margin is expended from the balance first.
④ Margin
It is the minimum amount of funds required to hold a new position. Required margin = currency unit × rate ÷ leverage
⑤ Floating P/L
The total amount of profits and losses calculated based on the current market price of the open position(s). Commissions and swaps are not included. P&L = (open price - current price) × contract size × lot
⑥ Margin level
It is the ratio of required margin to effective margin. Margin maintenance ratio = effective margin ÷ required margin
⑦ Equity
It is a balance of margin calculated by adding unrealized profits/losses to the account balance. Effective margin = account balance (margin) + unrealized profits/losses
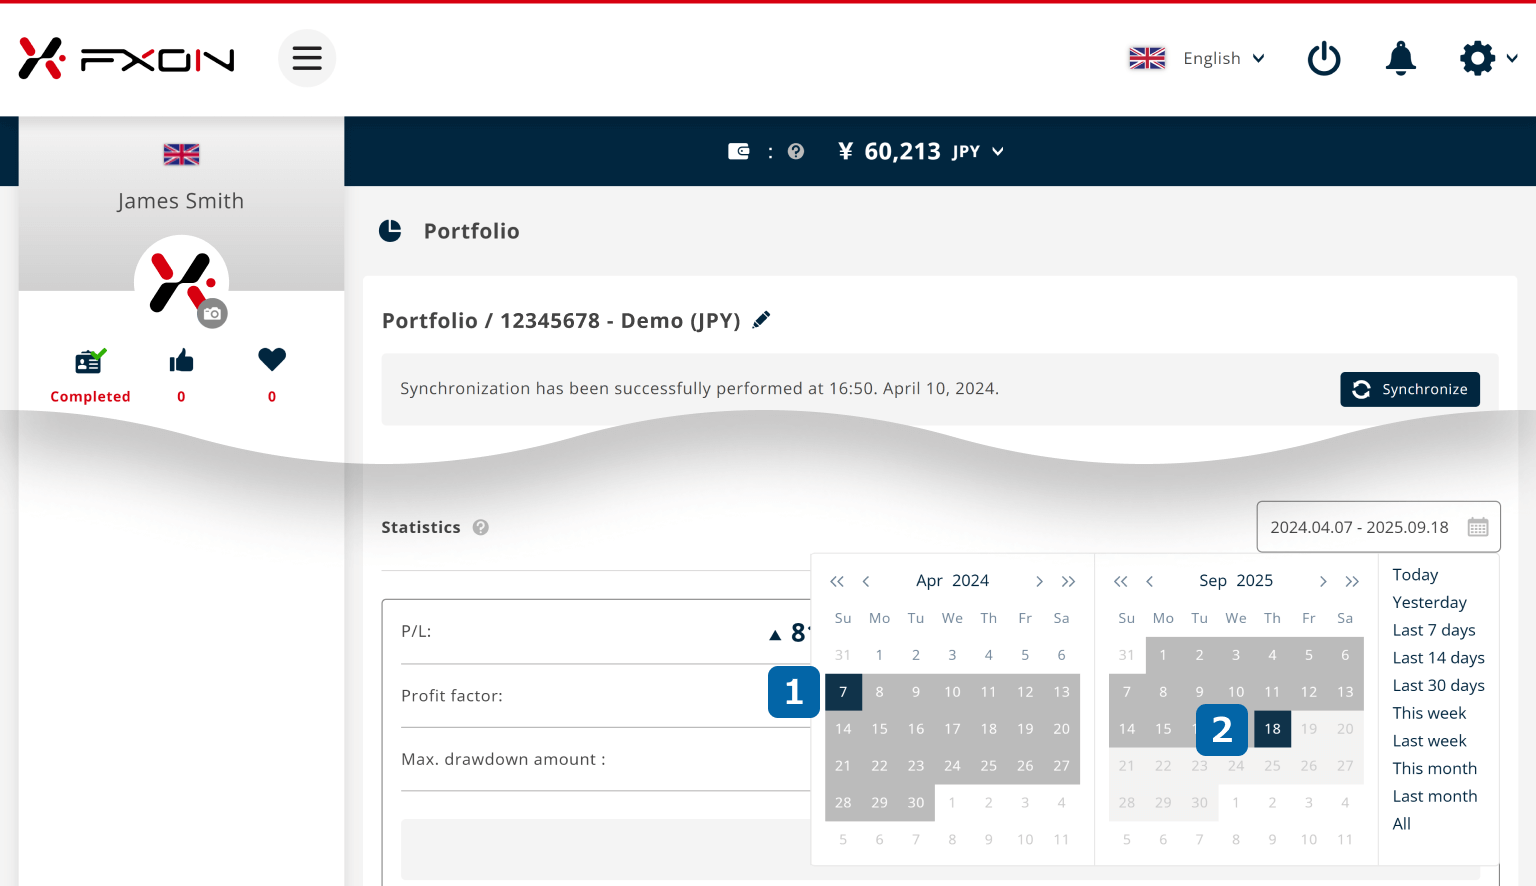
Statistics
The statistics show detailed information about your trades (positions) for a set period of time.
Click the calendar icon and select the period ((1) start date and (2) end date) for the summary.
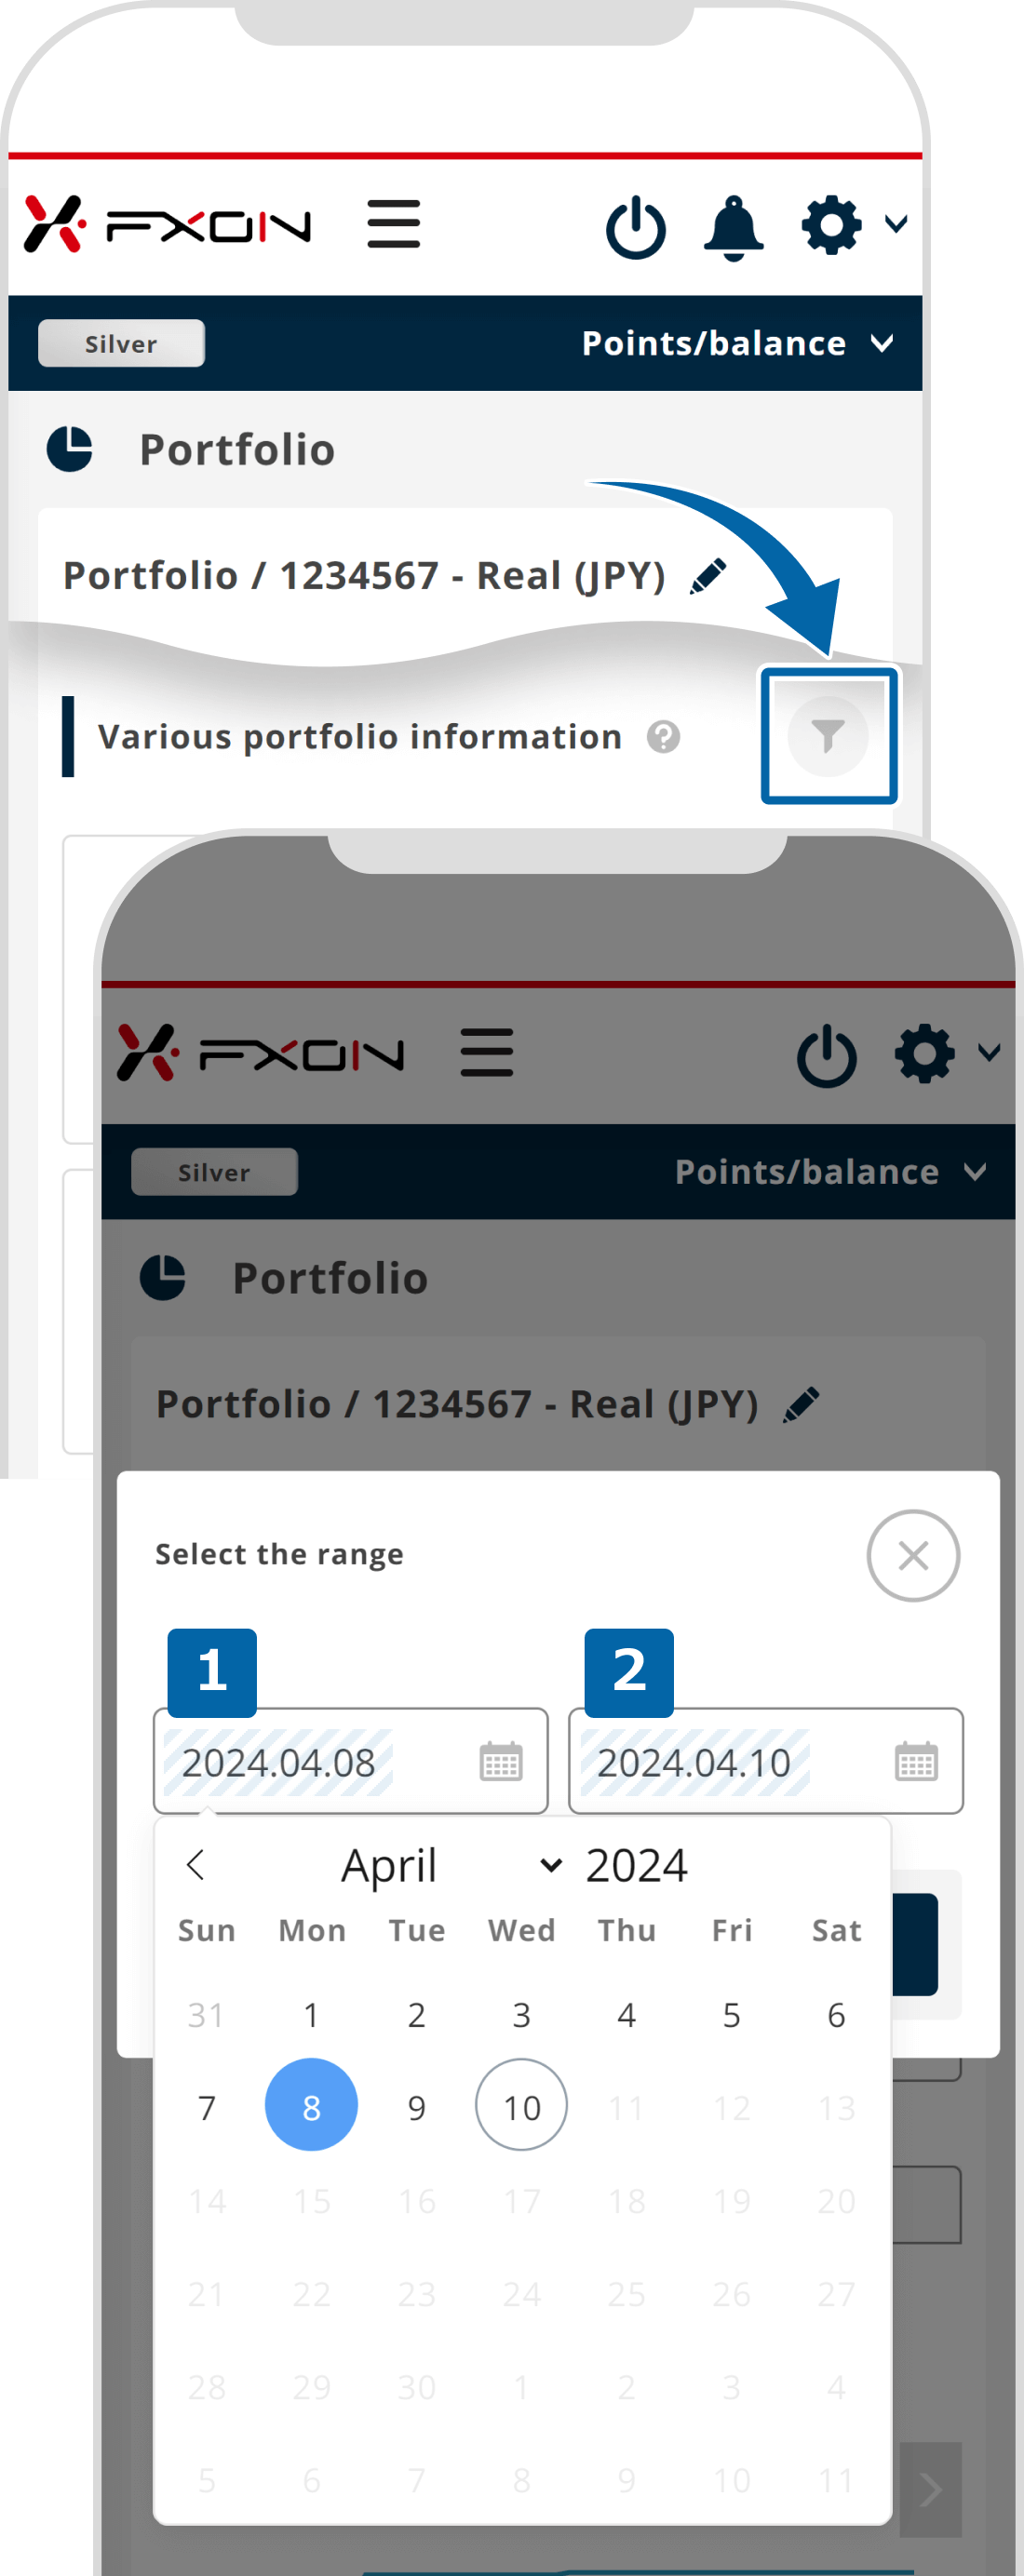
The statistics show detailed information about trades (positions) made for each trading account over a set period of time.
Tap the calendar icon > tap "All" to open the calendar, then select the period ((1) start date and (2) end date) for the summary, and tap "Apply filter".
STEP 1
Tap the calendar icon
STEP 2
Select the start date and end date
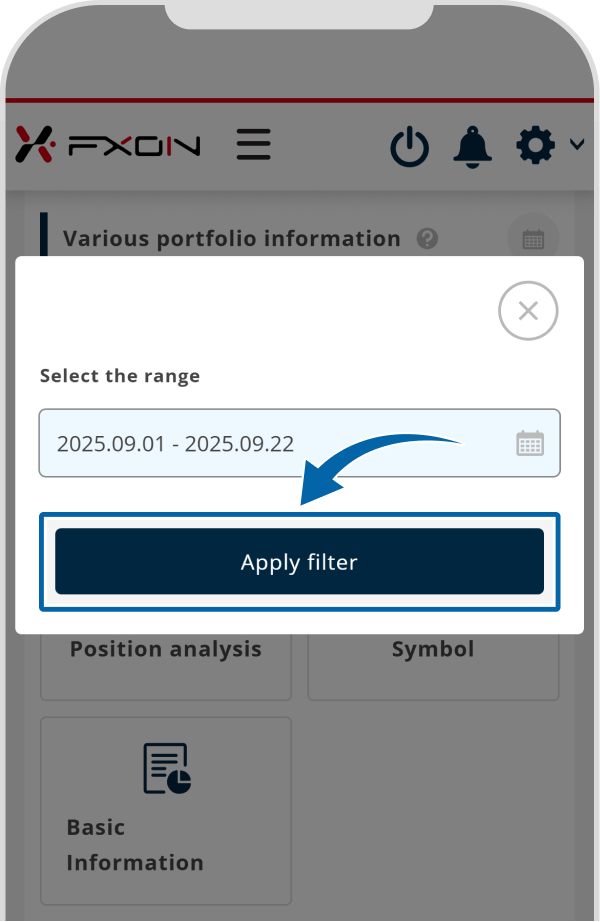
STEP 3
Tap "Apply filter"
For more information on the definitions and calculations of profit and loss and each margin, please refer to the following.
For more information on the definitions and calculations of profit and loss and each margin, please refer to the following.
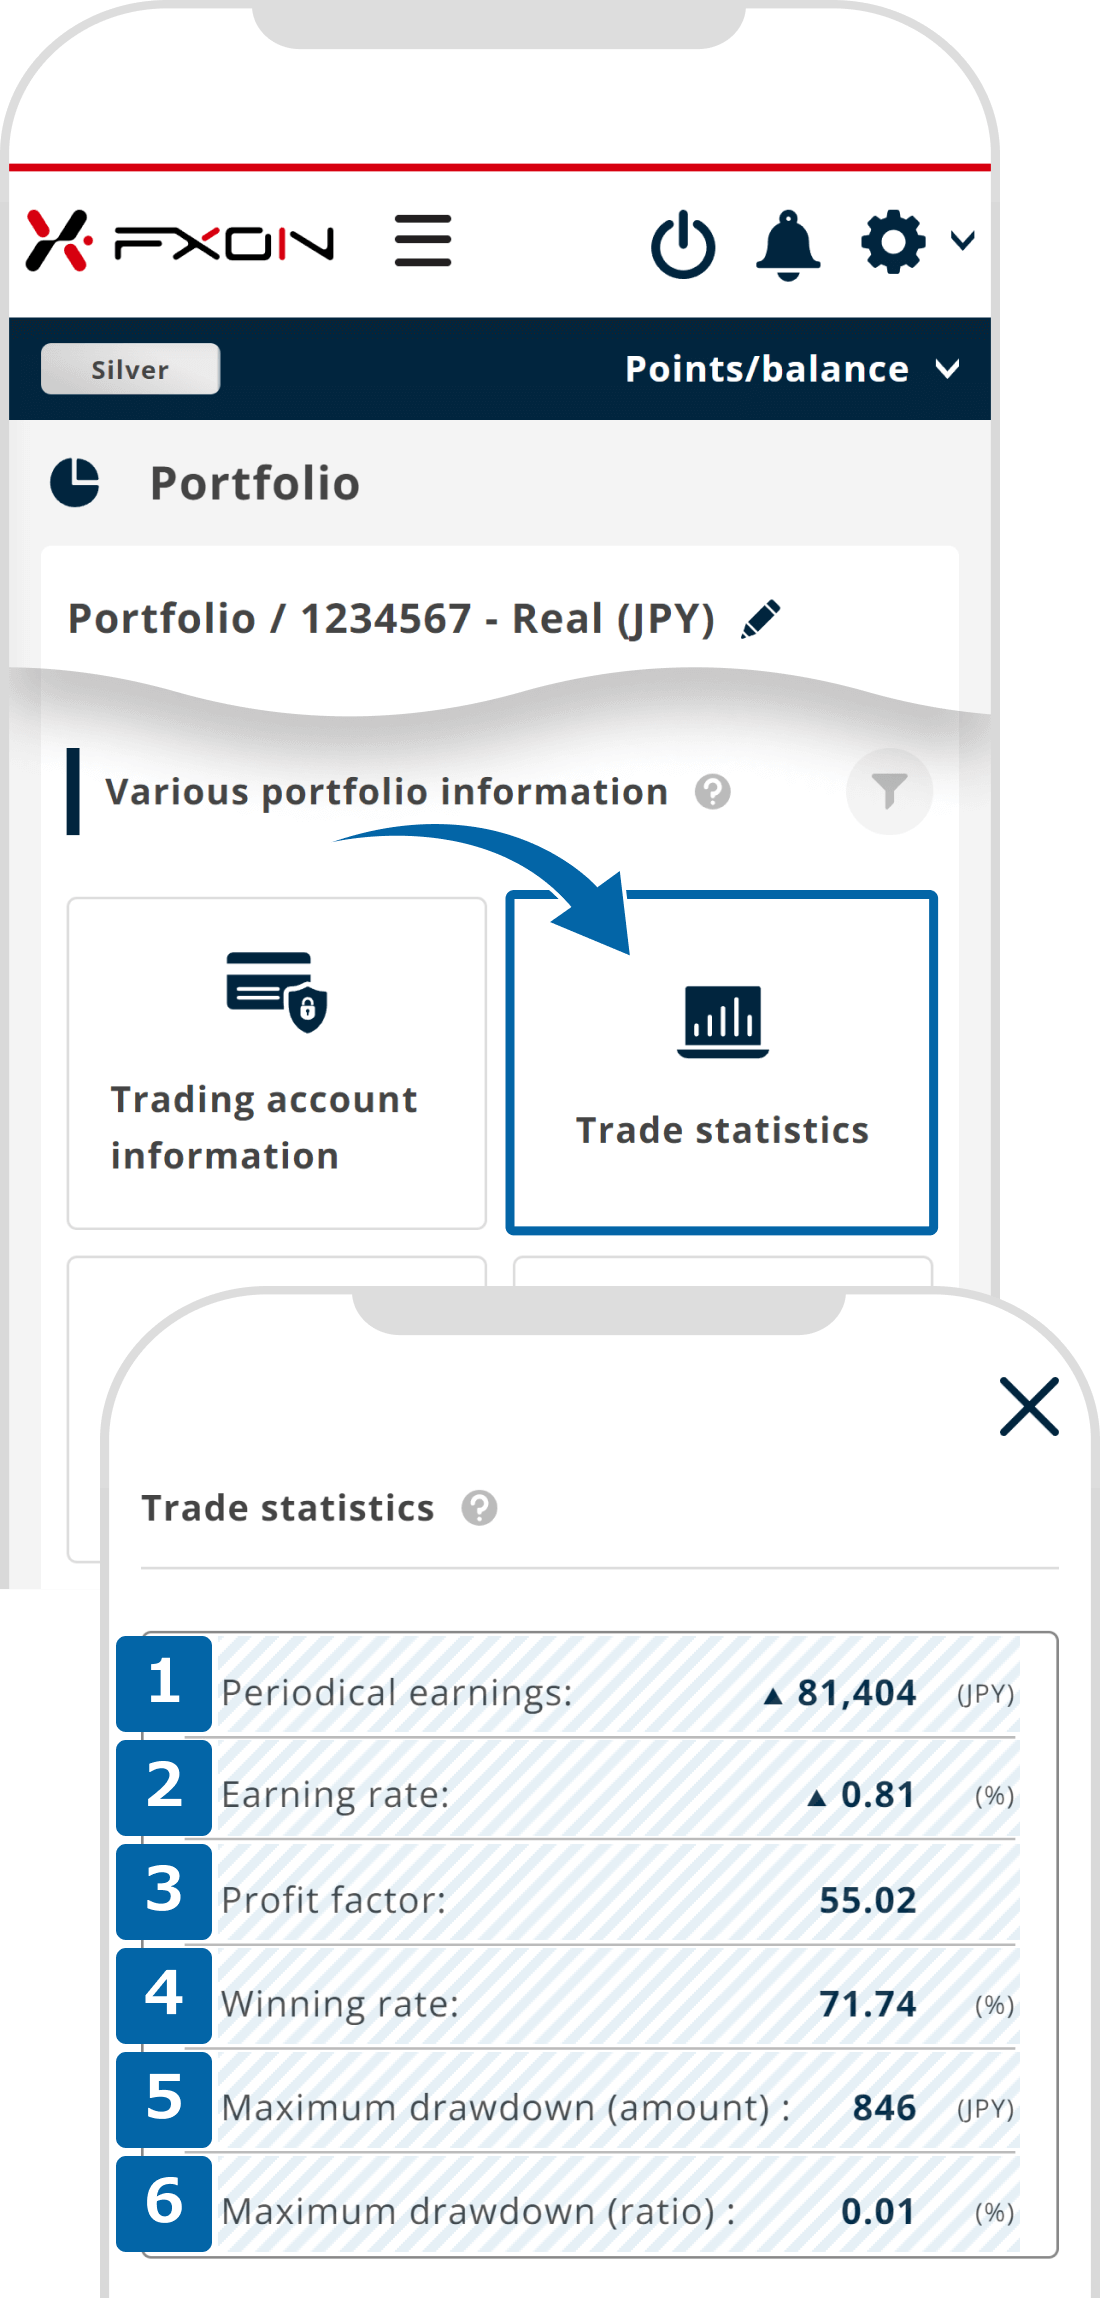
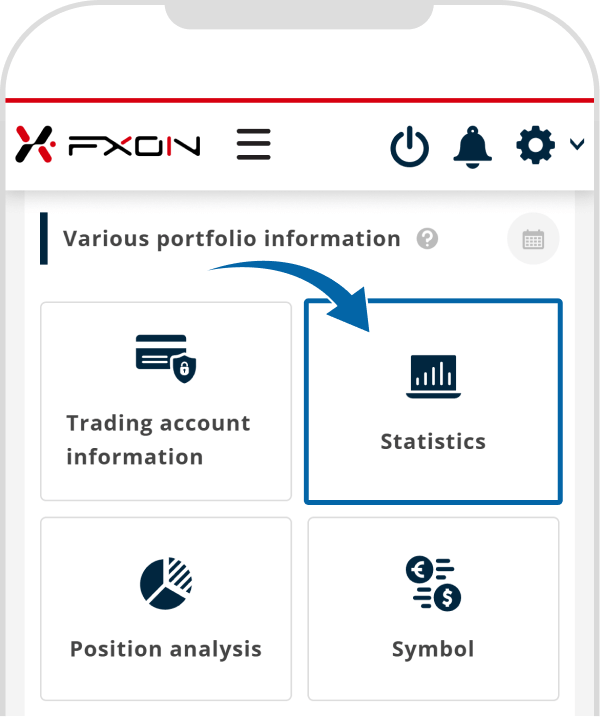
STEP 1
Tap "Statistics"
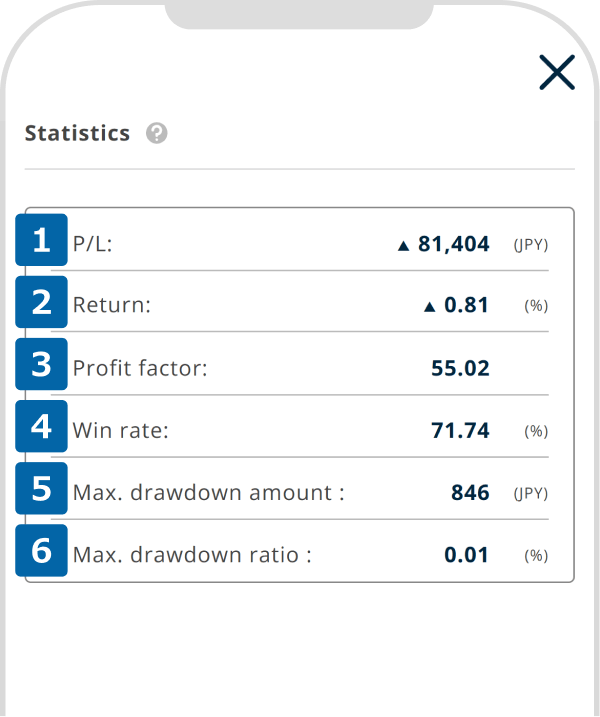
STEP 2
Statistics details are displayed
① Period P/L (realized)
Total P/L of closed positions in the selected period. A black ▲ indicates a profit, while a red ▲ indicates a loss.
② Period return (realized)
The rate of return for the period is displayed. Period profit ÷ (starting balance + cash deposit + credit deposit) × 100
③ Profit Factor
The amount obtained by dividing the profit for the given period by the loss. Profit factor = total profit ÷ total loss
④ Win rate
It is the percentage of winning trades. Number of winning trades ÷ total number of trades × 100
⑤ Max. drawdown amount (Amount)
It shows the maximum drawdown of the balance during a set period.
⑥ Max. drawdown ratio
It shows the maximum percentage decrease in the balance during a set period.
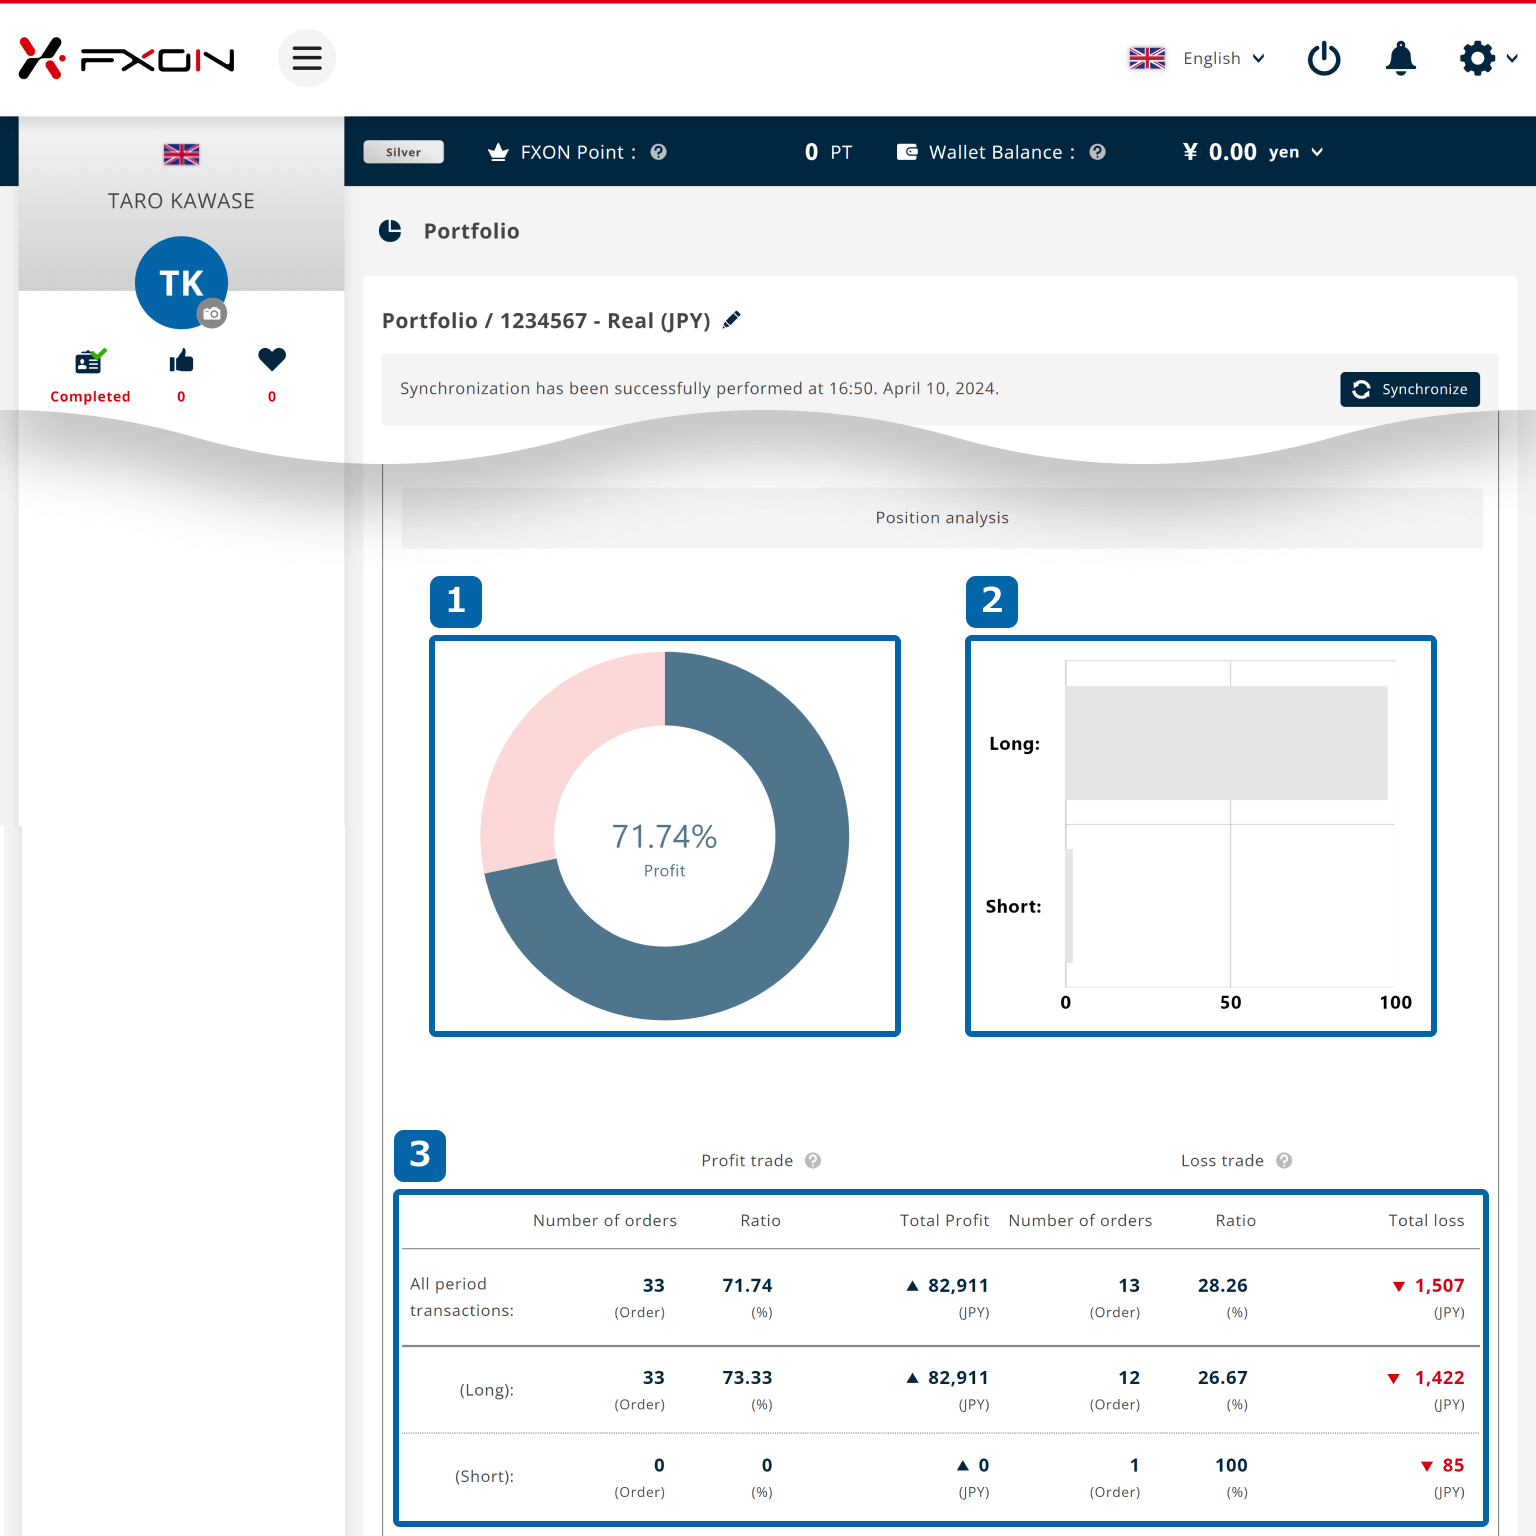
Position analysis
The position analysis divides trades into profit and loss trades and shows the breakdown of the long and short positions. This helps you to understand trends in the number of orders and profit/loss ratios to date, and helps you to develop a trading strategy for the future.
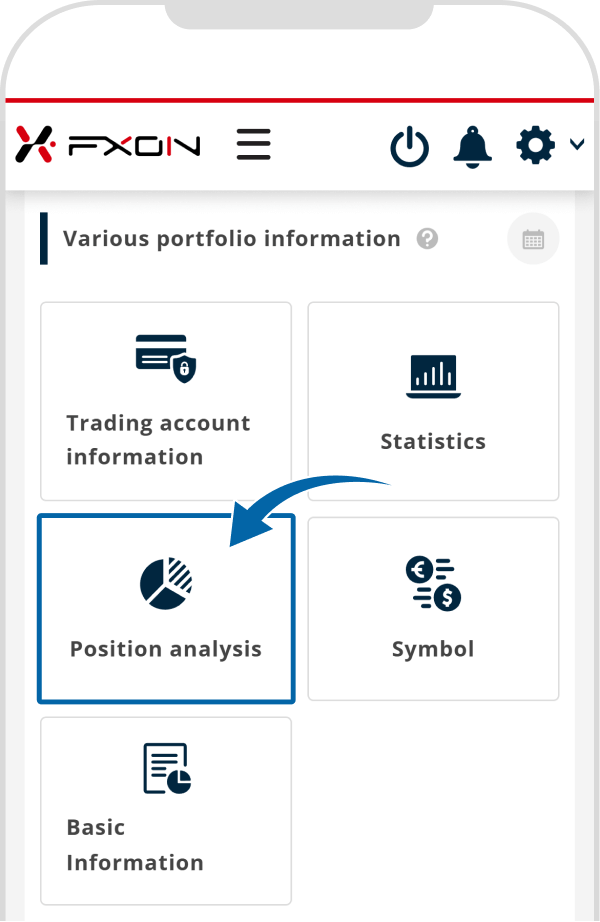
STEP 1
Tap "Position Analysis"
STEP 2
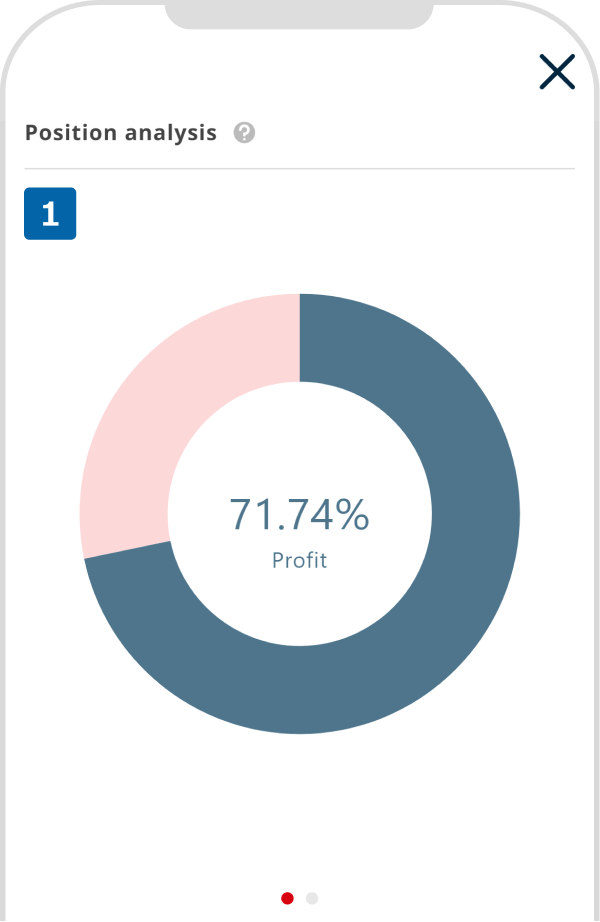
Display profit/Loss pie chart
STEP 3
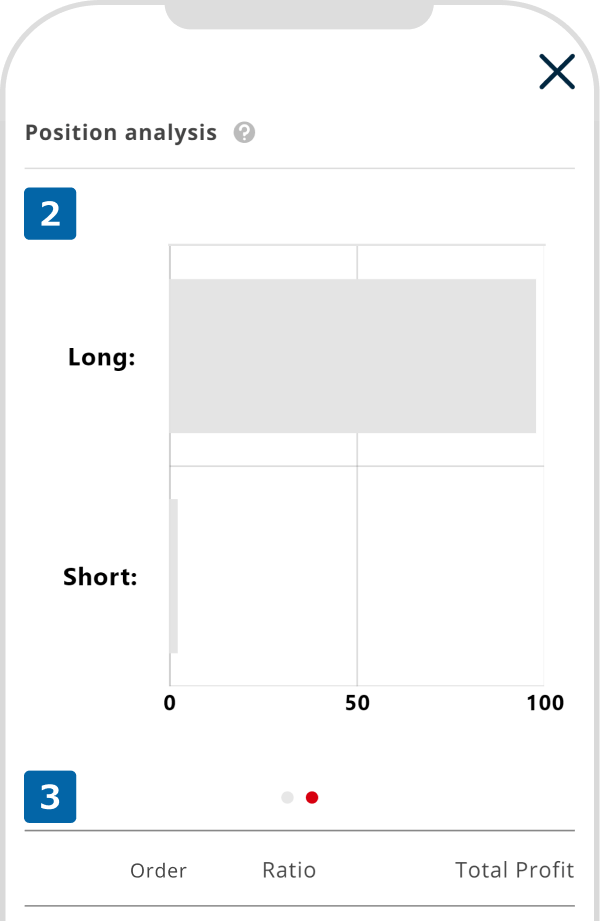
Display position ratio and P/L list
① Profit/Loss Trade Ratio
The pie chart shows the ratio of profit and loss trades.
② Long/Short Position Ratio
The bar graph shows the ratio of long (buy) and short (sell) trades.
③ List of Profit and Loss Trades
The table shows the number of orders, ratio and total profits for each profit and loss trade.
① Profit/Loss Trade Ratio
The pie chart shows the ratio of profit and loss trades.
② Long/Short Position Ratio*1
The bar graph shows the ratio of long (buy) and short (sell) trades.
③ List of Profit and Loss Trades
The table shows the number of orders, ratio and total profits for each profit and loss trade.
*1The Long/Short Position Ratio is displayed when you slide the screen to the left.
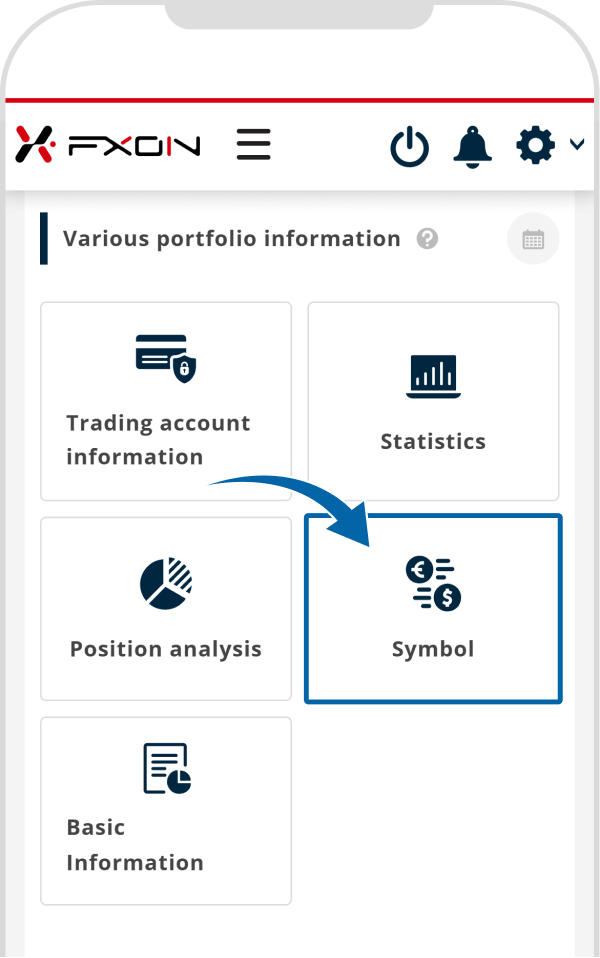
Symbol
The symbol shows the number of lots traded, number of orders, ratio and total profit/loss for each stock that has been traded so far. The winning rate and profit/loss for each stock can be grasped.
STEP 1
Tap "Symbol"
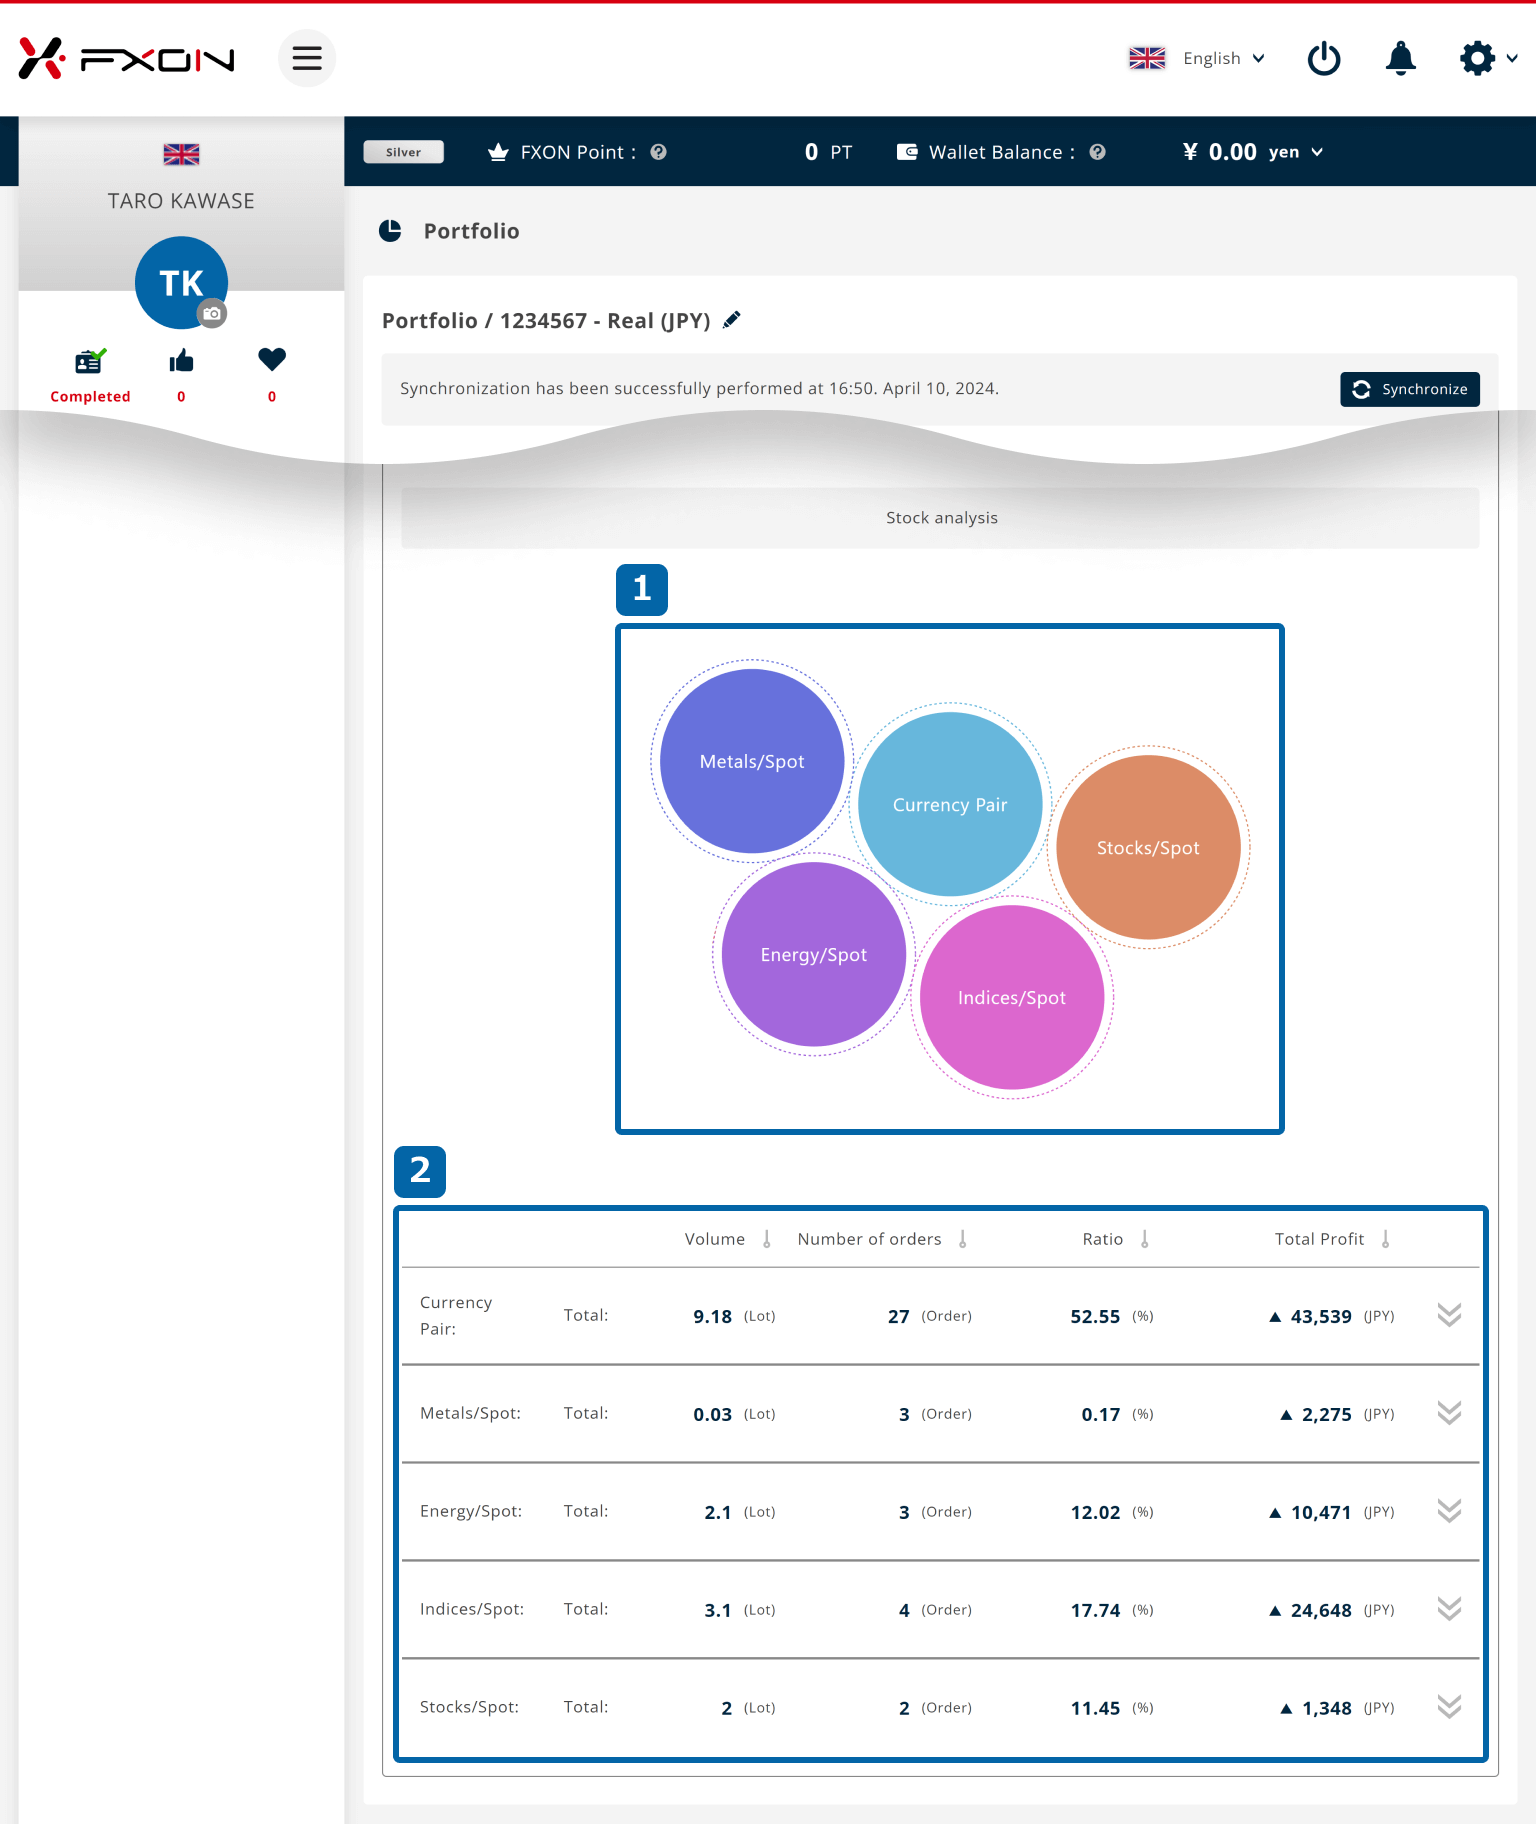
STEP 2
Bubble chart by holdings is displayed
STEP 3
Profit/Loss and holding ratio by product category are displayed
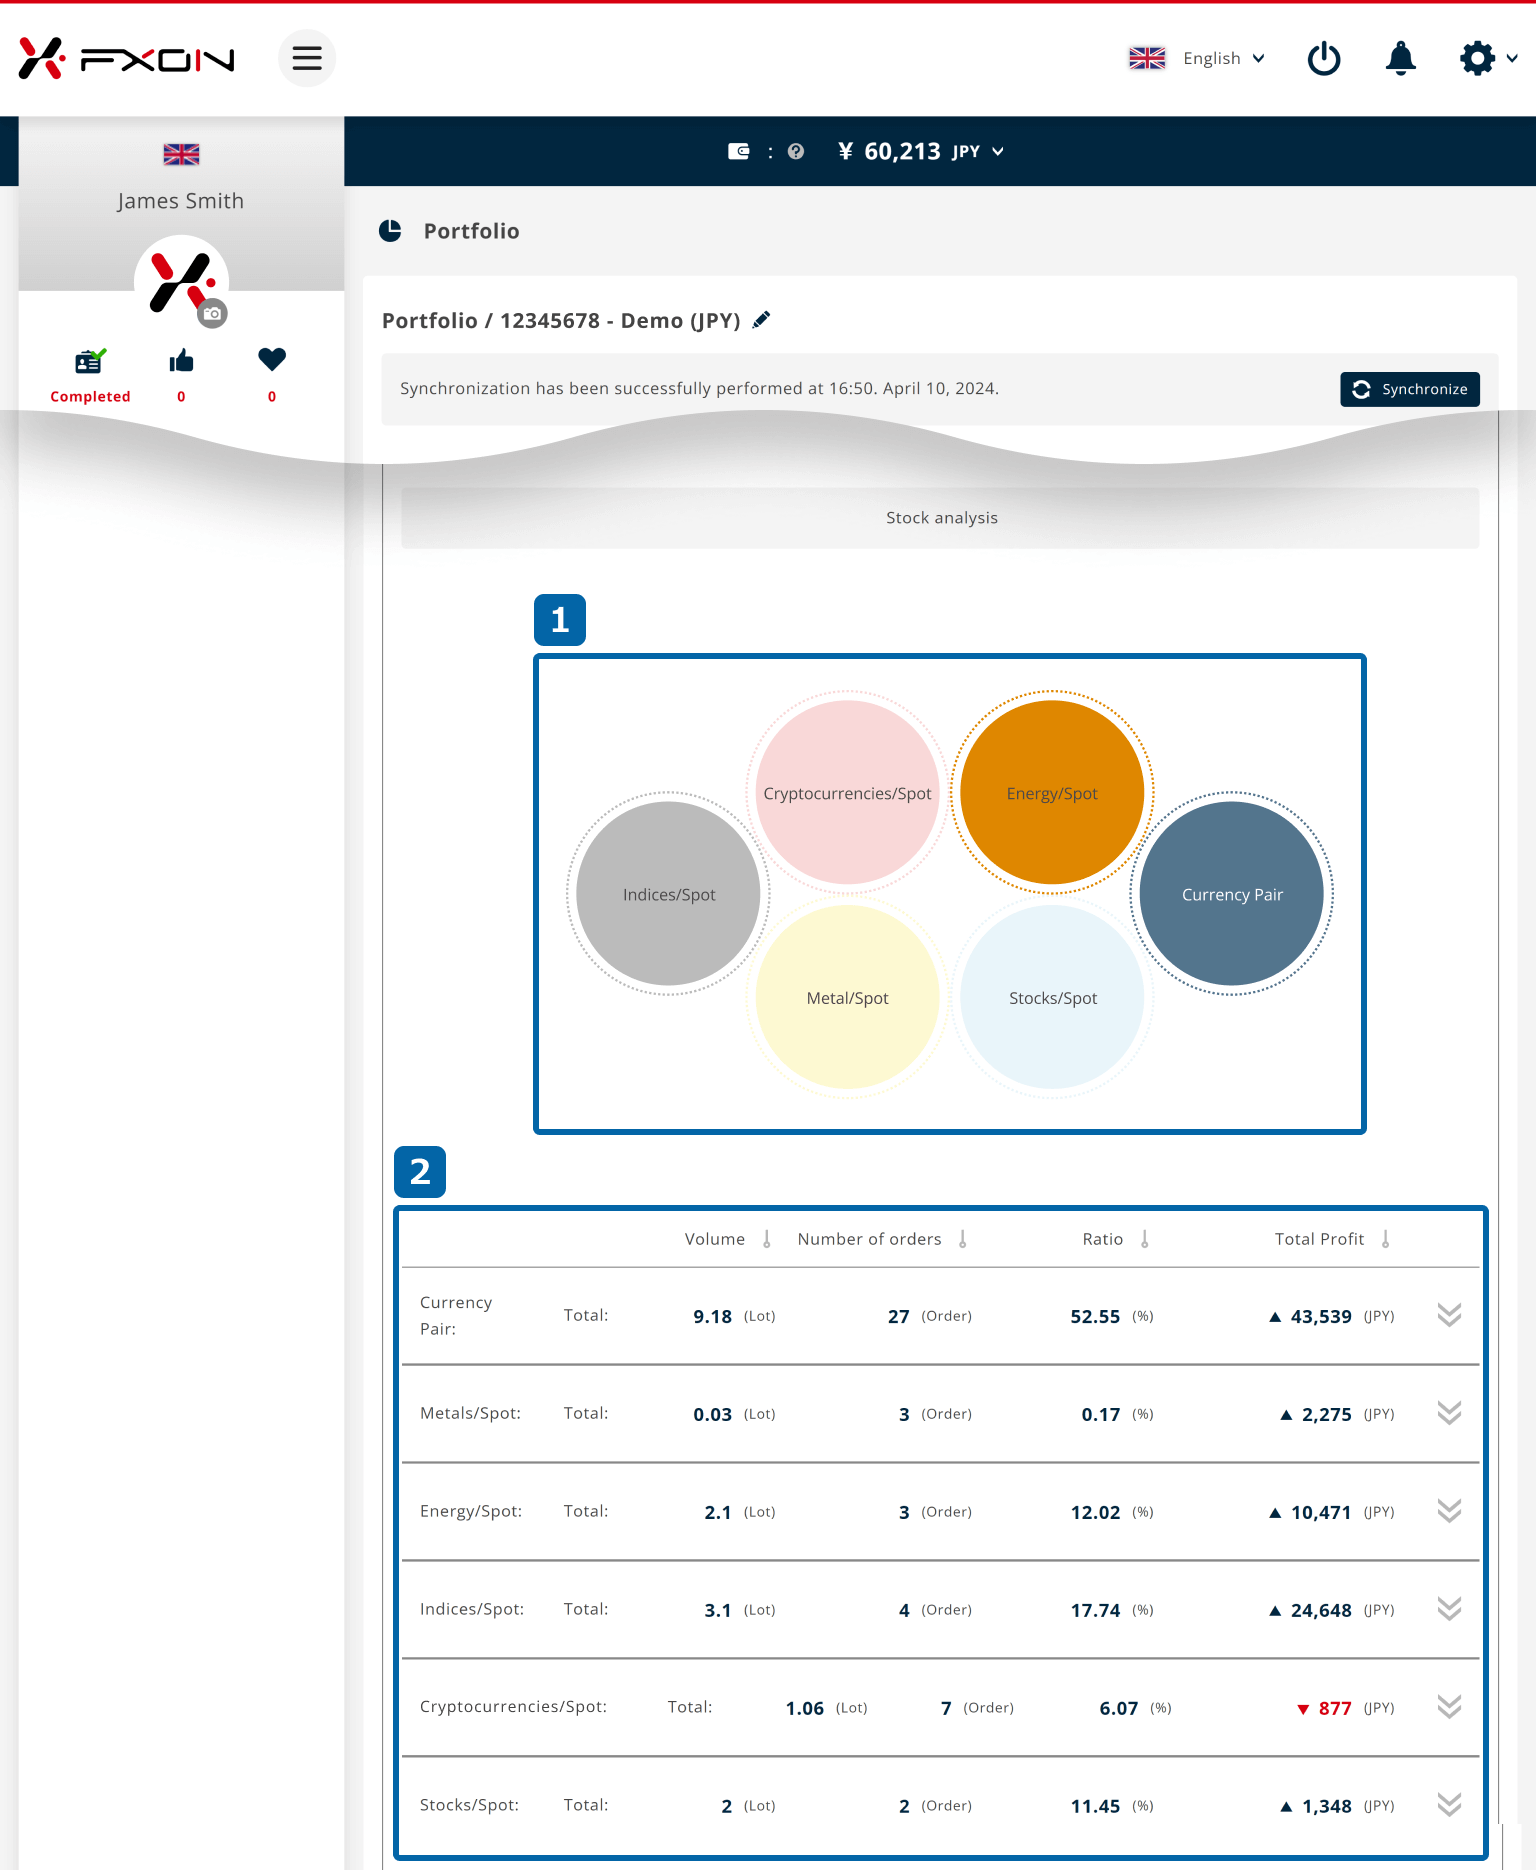
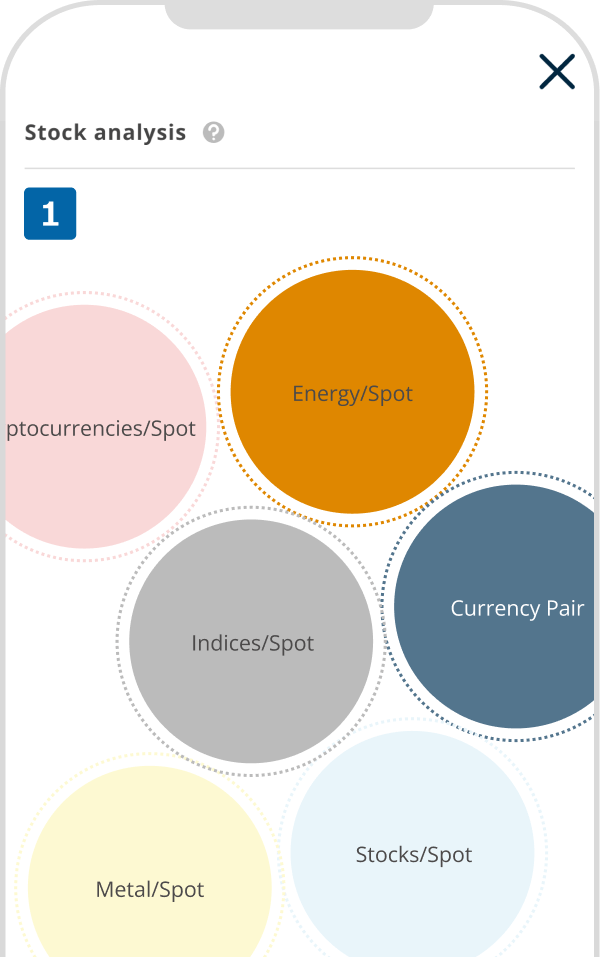
① Bubble Chart by Category
Each category (Currency Pair, Metals/Spot, Energy/Spot, Indices/Spot, Cryptocurrencies/Spot, Stocks/Spot) is shown in the bubble chart, and the size of the circle is expressed in proportion to the volume of transactions. By clicking each circle, its issue will be displayed.
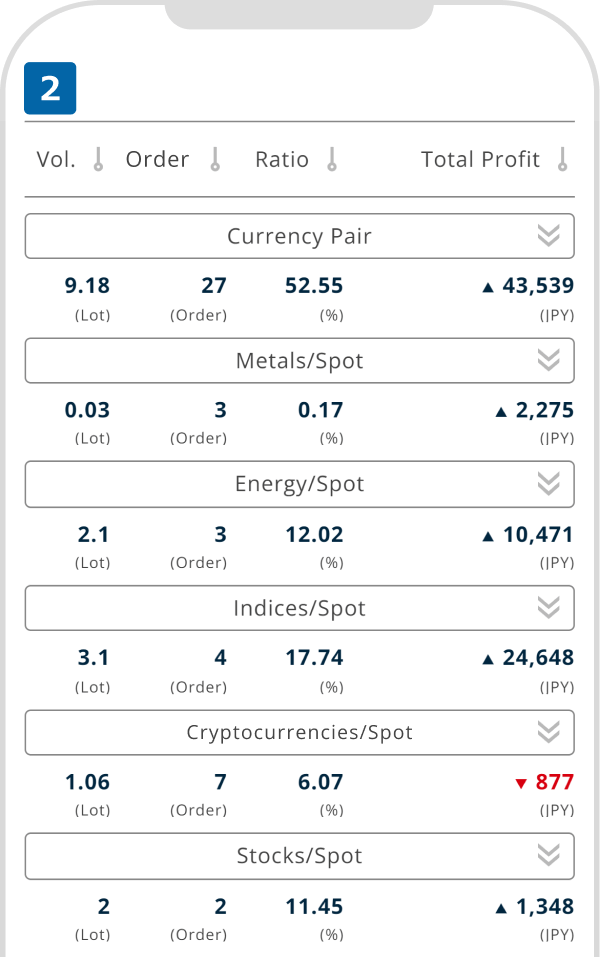
② List by Category
The volumes (number of lots traded), number of orders, ratio and total profits/losses are shown by category (Currency Pair, Metals/Spot, Energy/Spot, Indices/Spot, Cryptocurrencies/Spot, Stocks/Spot). Click "∨" on an issue to see the breakdown for each individual issue.
① Bubble Chart by Category
Each category (Currency Pair, Metals/Spot, Energy/Spot, Indices/Spot, Cryptocurrencies/Spot, Stocks/Spot) is shown in the bubble chart, and the size of the circle is expressed in proportion to the volume of transactions. By tapping each circle, its issue will be displayed.
② List by Category
The volumes (number of lots traded), number of orders, ratio and total profits/losses are shown by category (Currency Pair, Metals/Spot, Energy/Spot, Indices/Spot, Cryptocurrencies/Spot, Stocks/Spot). Tap "∨" on an issue to see the breakdown for each individual issue.
Tip
For details on the "Graph" on the Performance screen, please also refer to the FAQ below.