
Thrive as a Partner
How do I share the volatility analysis on social media?
Easy Sharing
Thrive as a Partner
This article was :
Published in 2025.01.15
Updated in 2025.09.26
With FXON's volatility analysis feature, you can analyze the price fluctuations of major instruments over a specified period. By using the share function, you can easily share your analysis on social media platforms such as Facebook and X (formerly Twitter). This feature is designed to enhance the efficiency of information gathering and sharing among traders.
Please ensure you are logged into the FXON portal when using the share function. Your partner code will be embedded in the shared link, enabling more effective promotional activities.
Please refer to the following steps to use the share function.
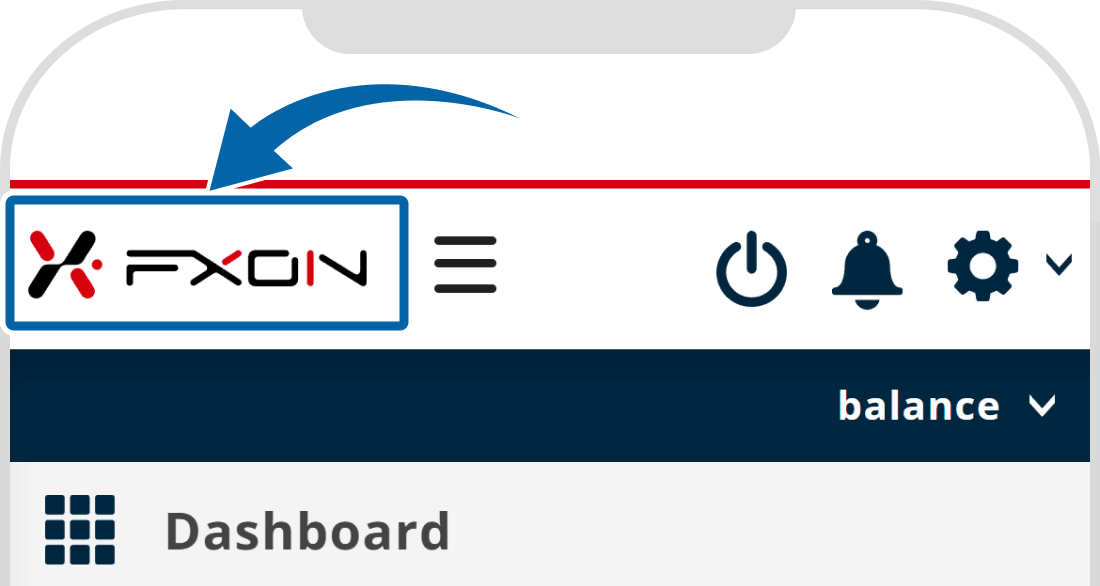
After logging into the FXON portal, click the "FXON" logo at the top left of the screen.
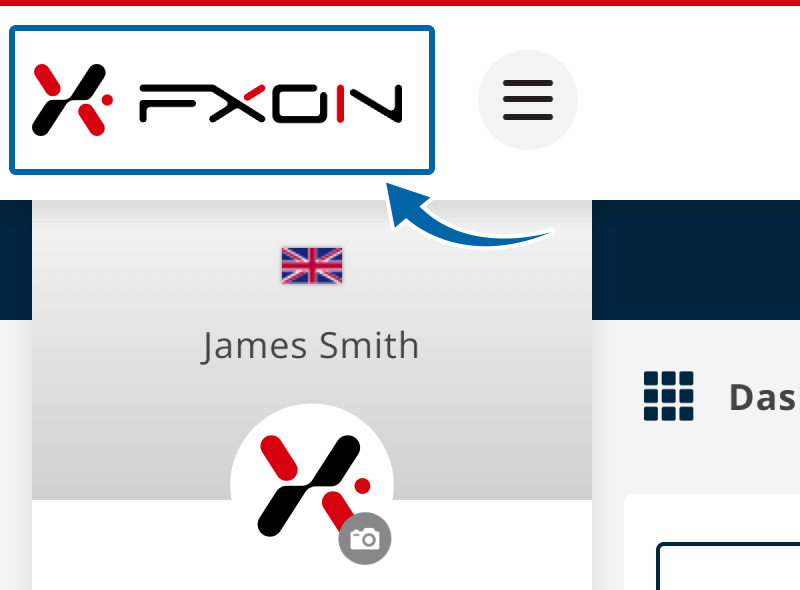
After logging into the FXON portal, tap the "FXON" logo at the top left of the screen.
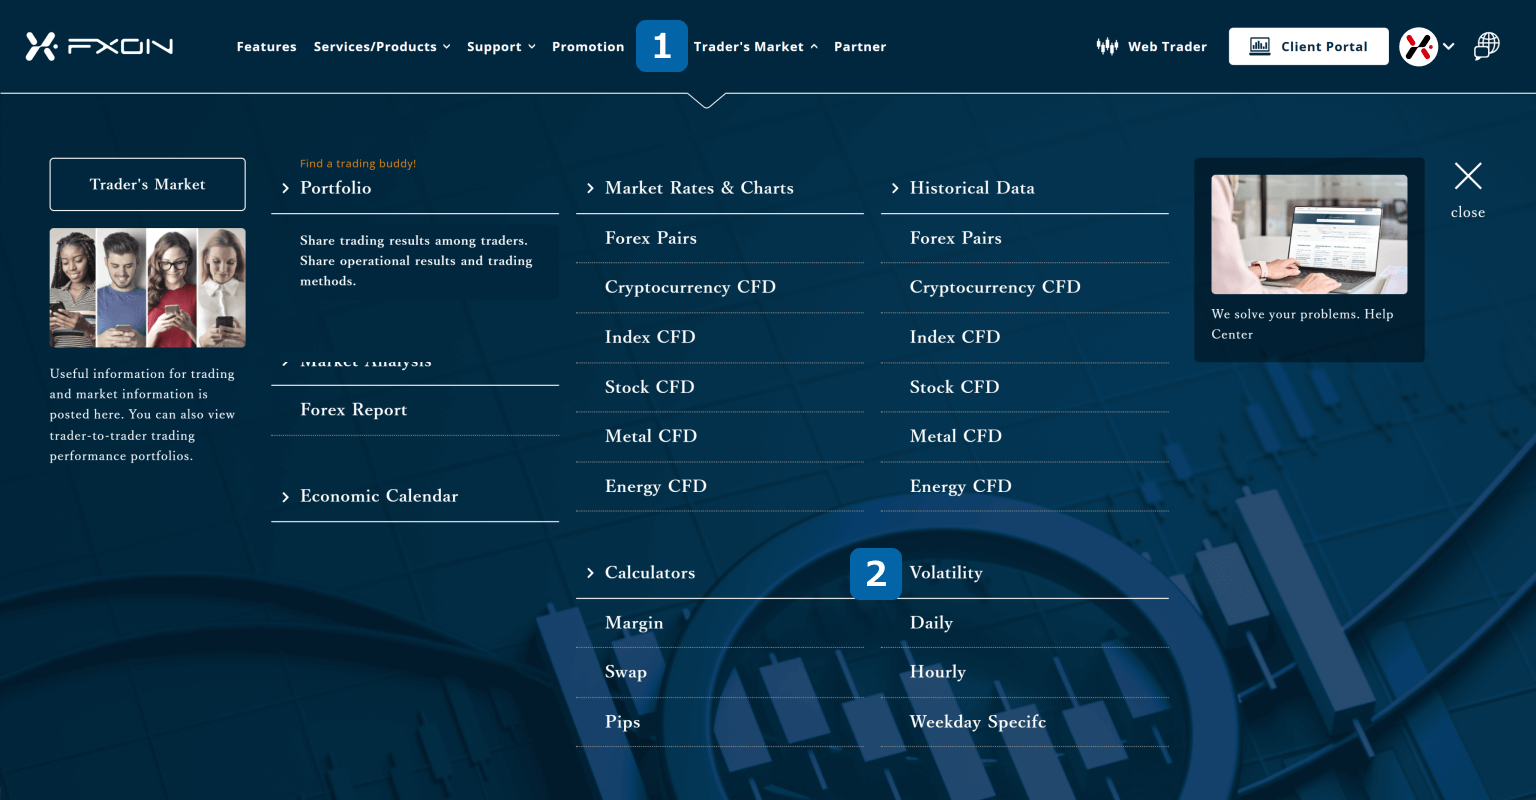
At the top of the FXON website, click (1) "Trader's Market" > (2) "See Details" under Volatility Analysis.
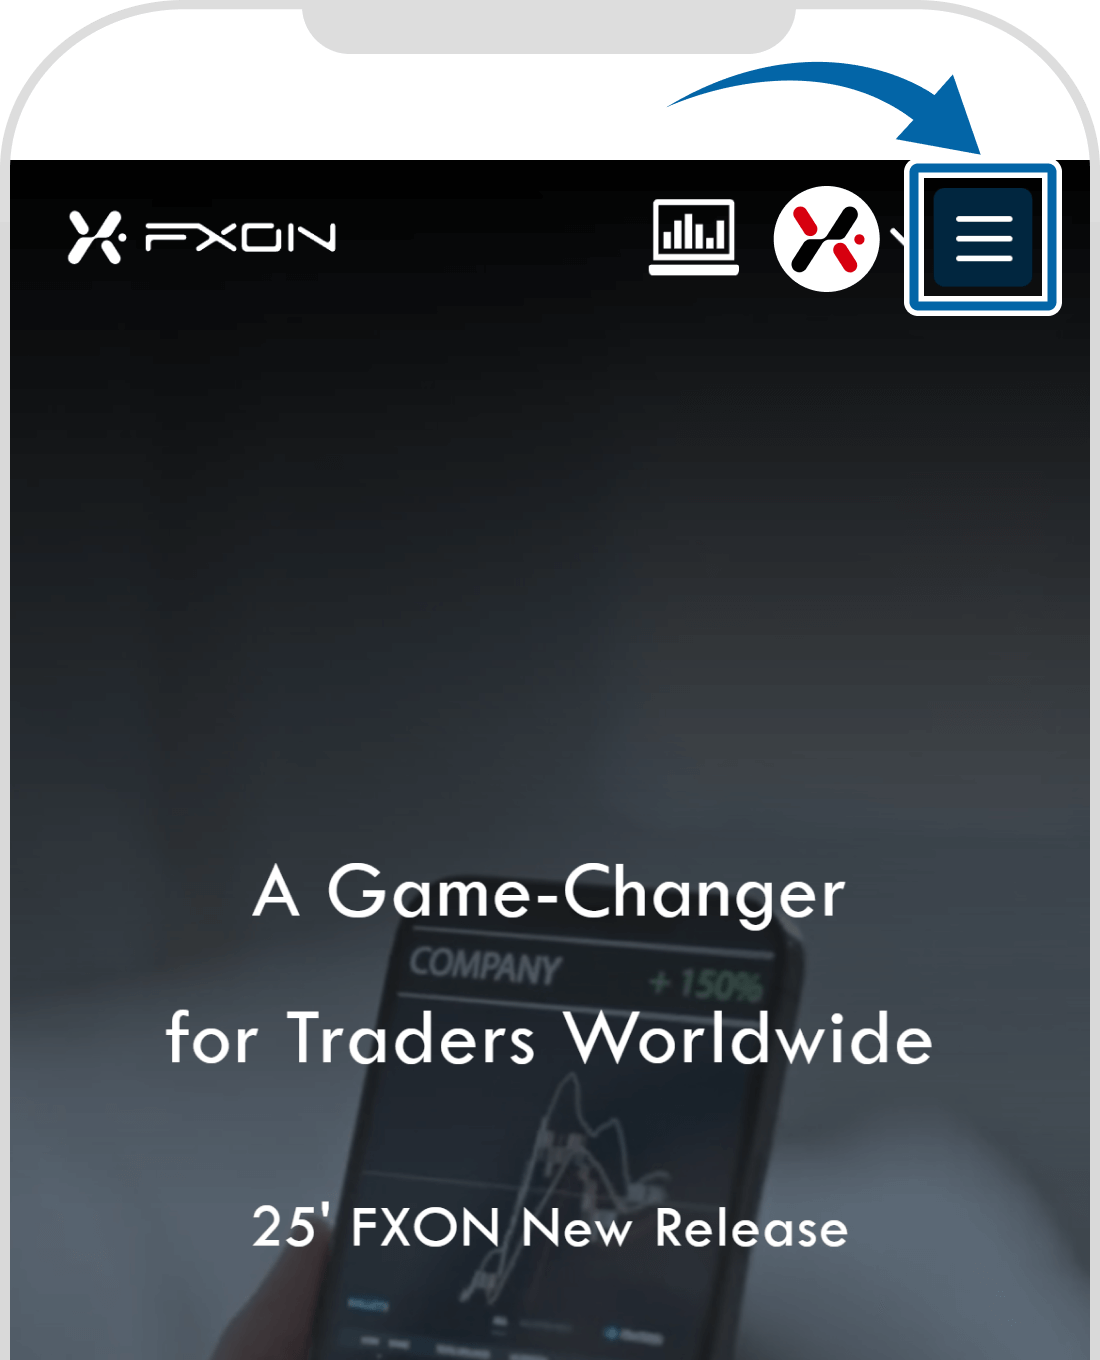
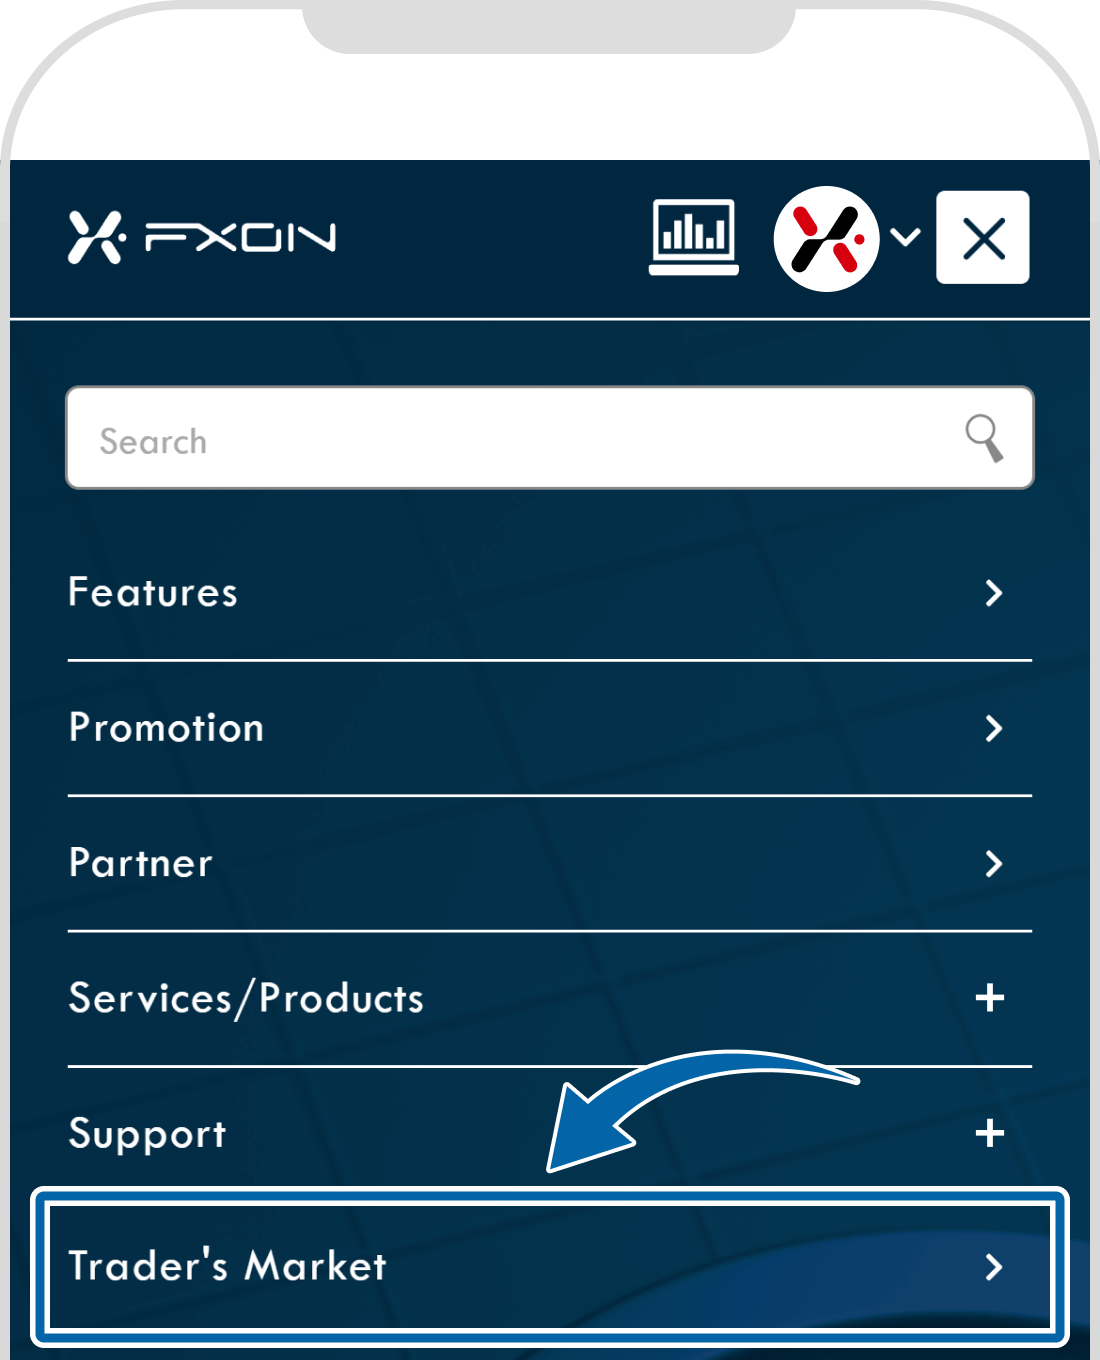
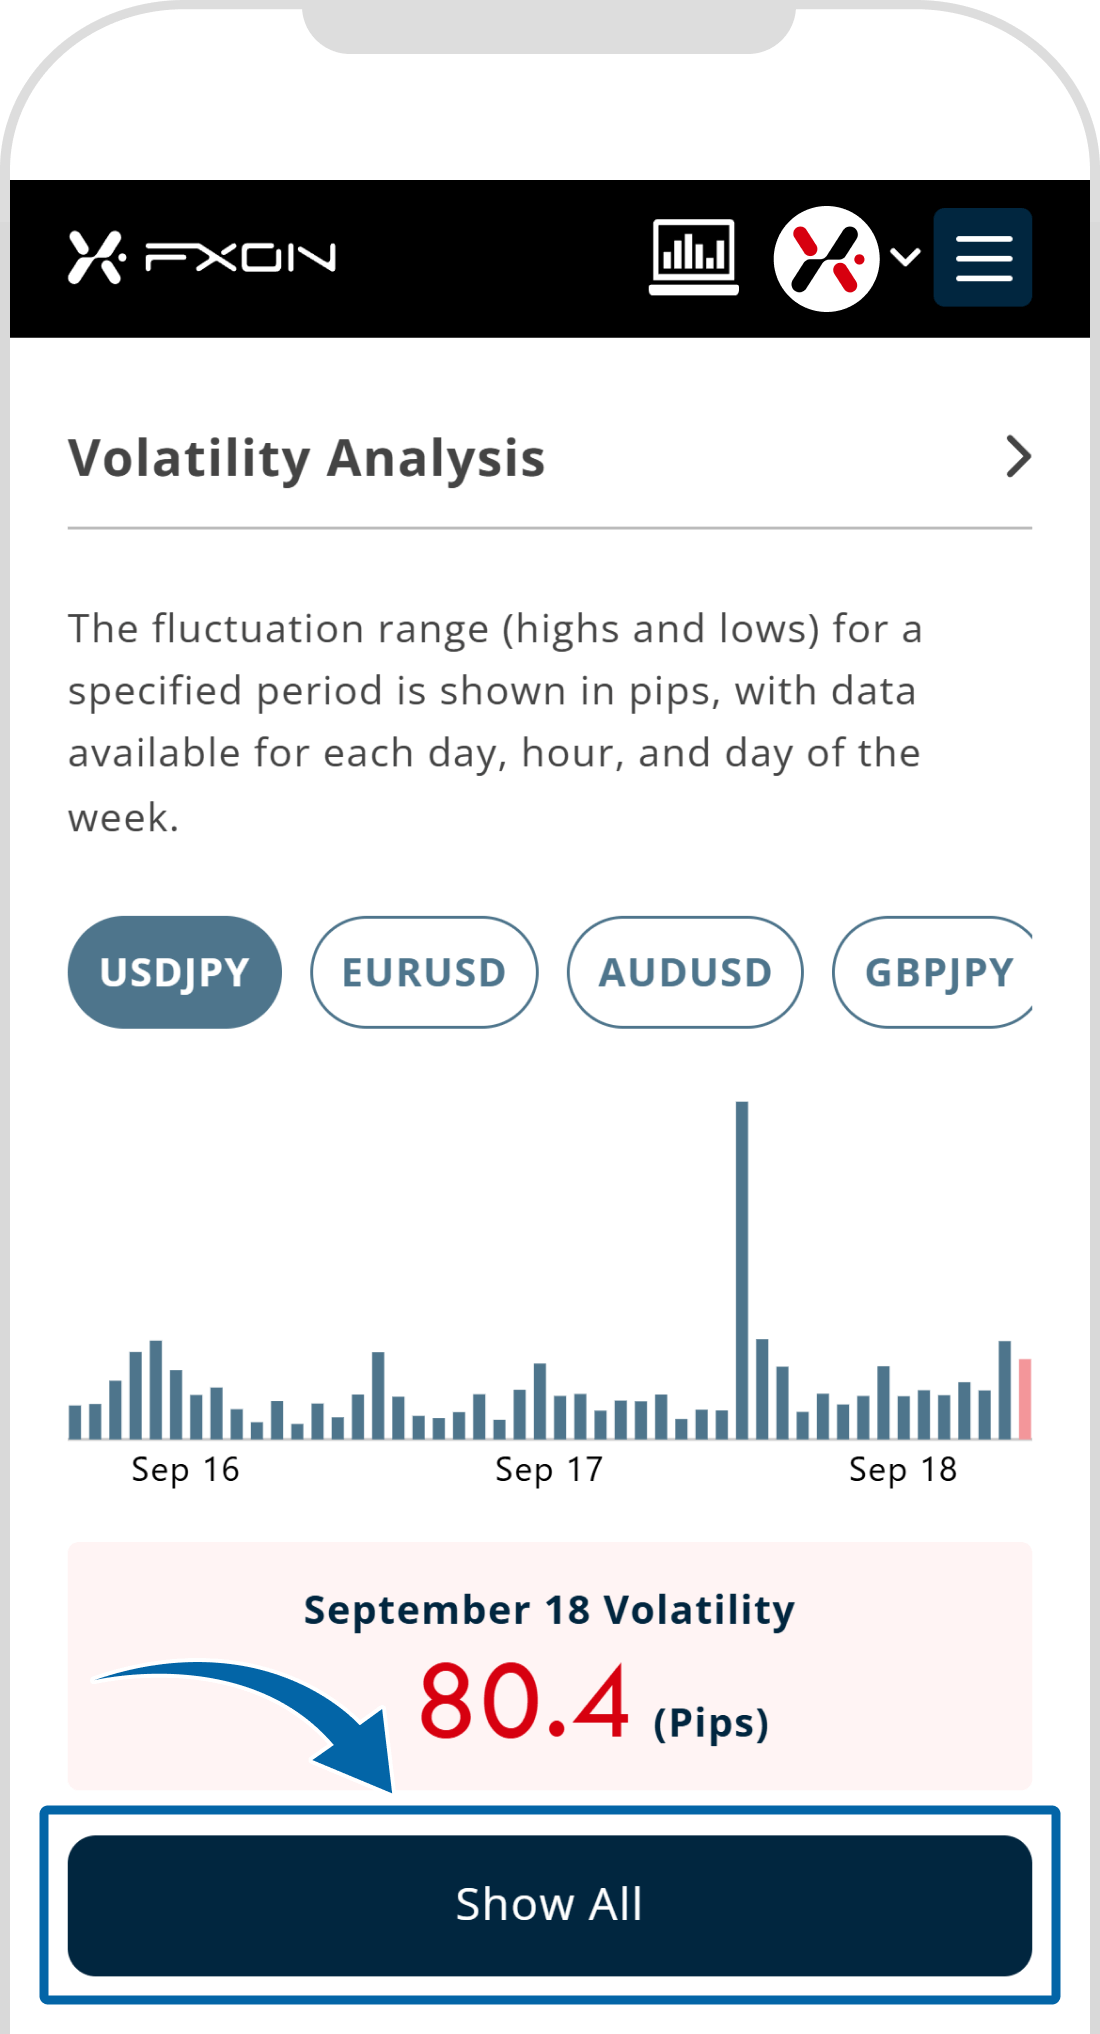
Tap the three lines (≡) at the top of the FXON website, tap "Trader's Market." Scroll down the screen to display Volatility Analysis, then tap "Show All".
Open Menu
Tap "Trader's Market"
Tap "Show All"
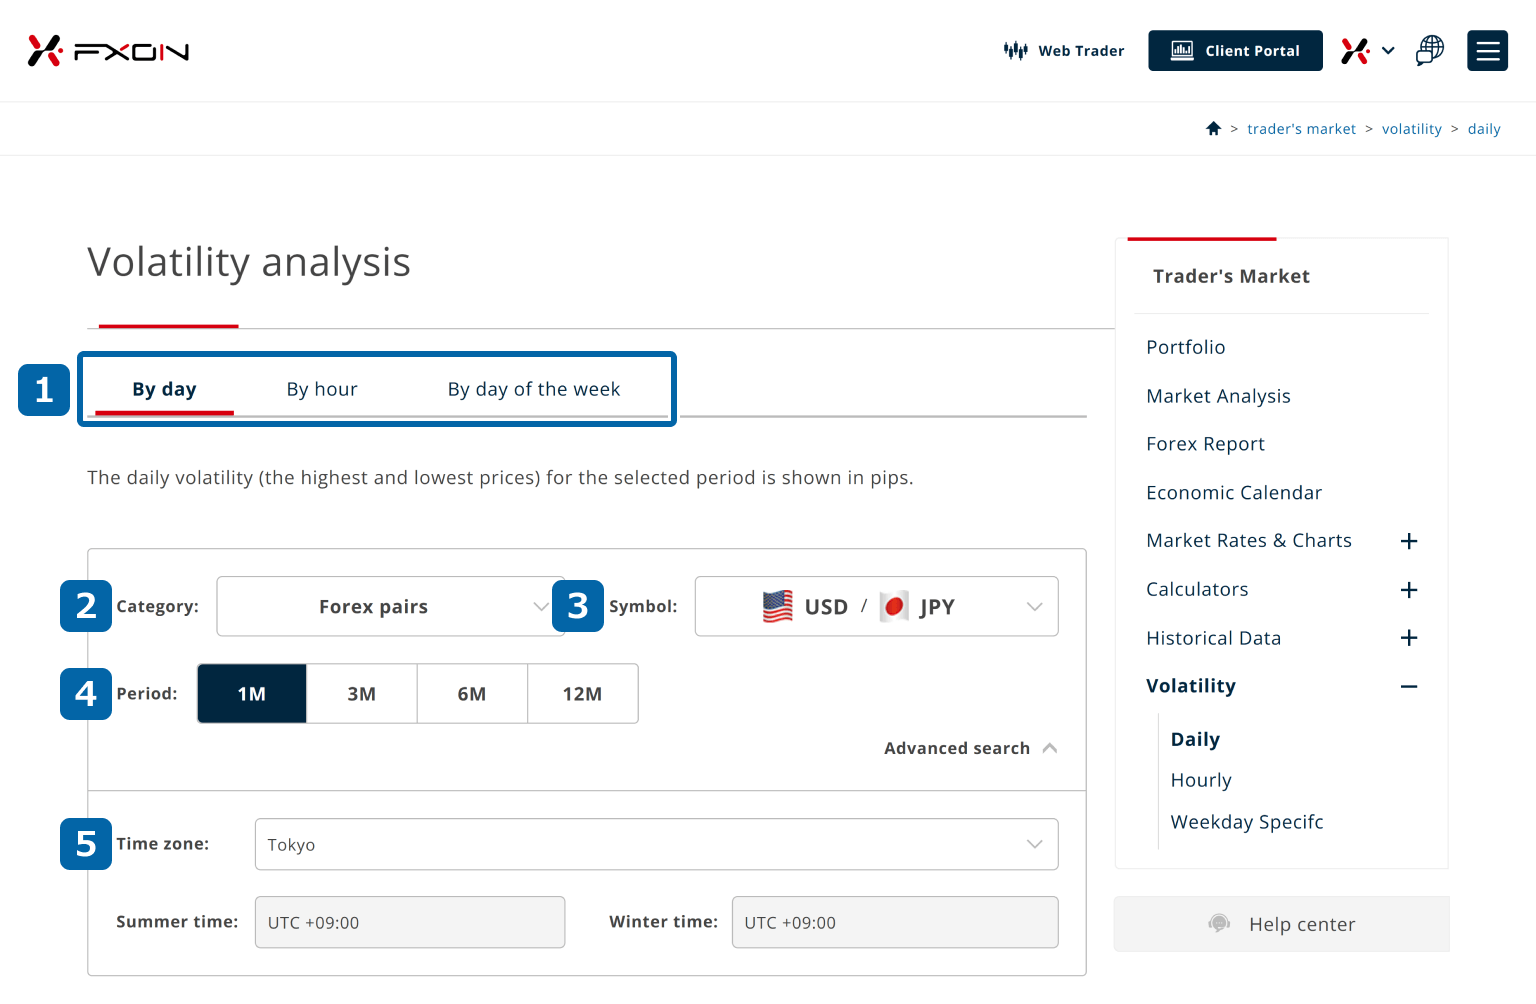
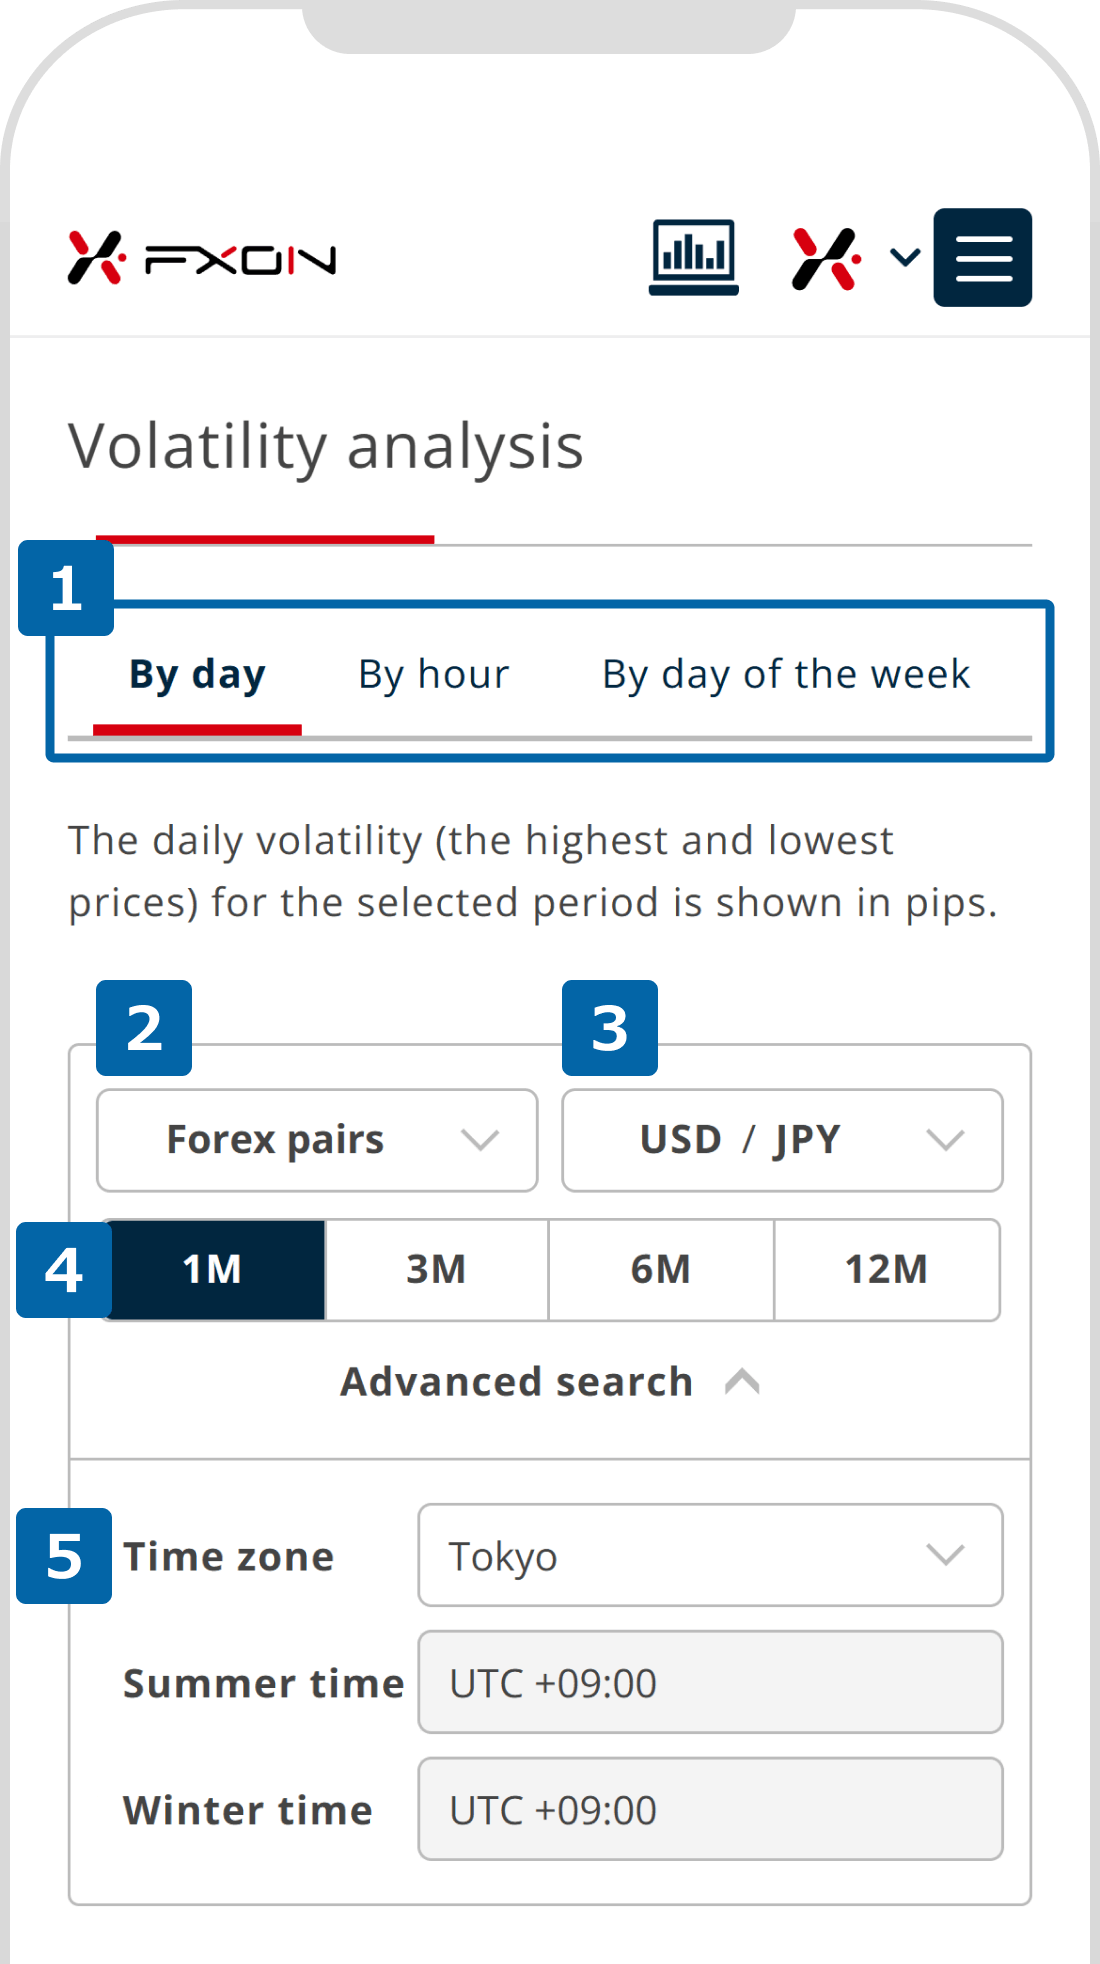
Select the following options: (1) By day, (2) Category, (3) Symbol, (4) Period, (5) Time zone
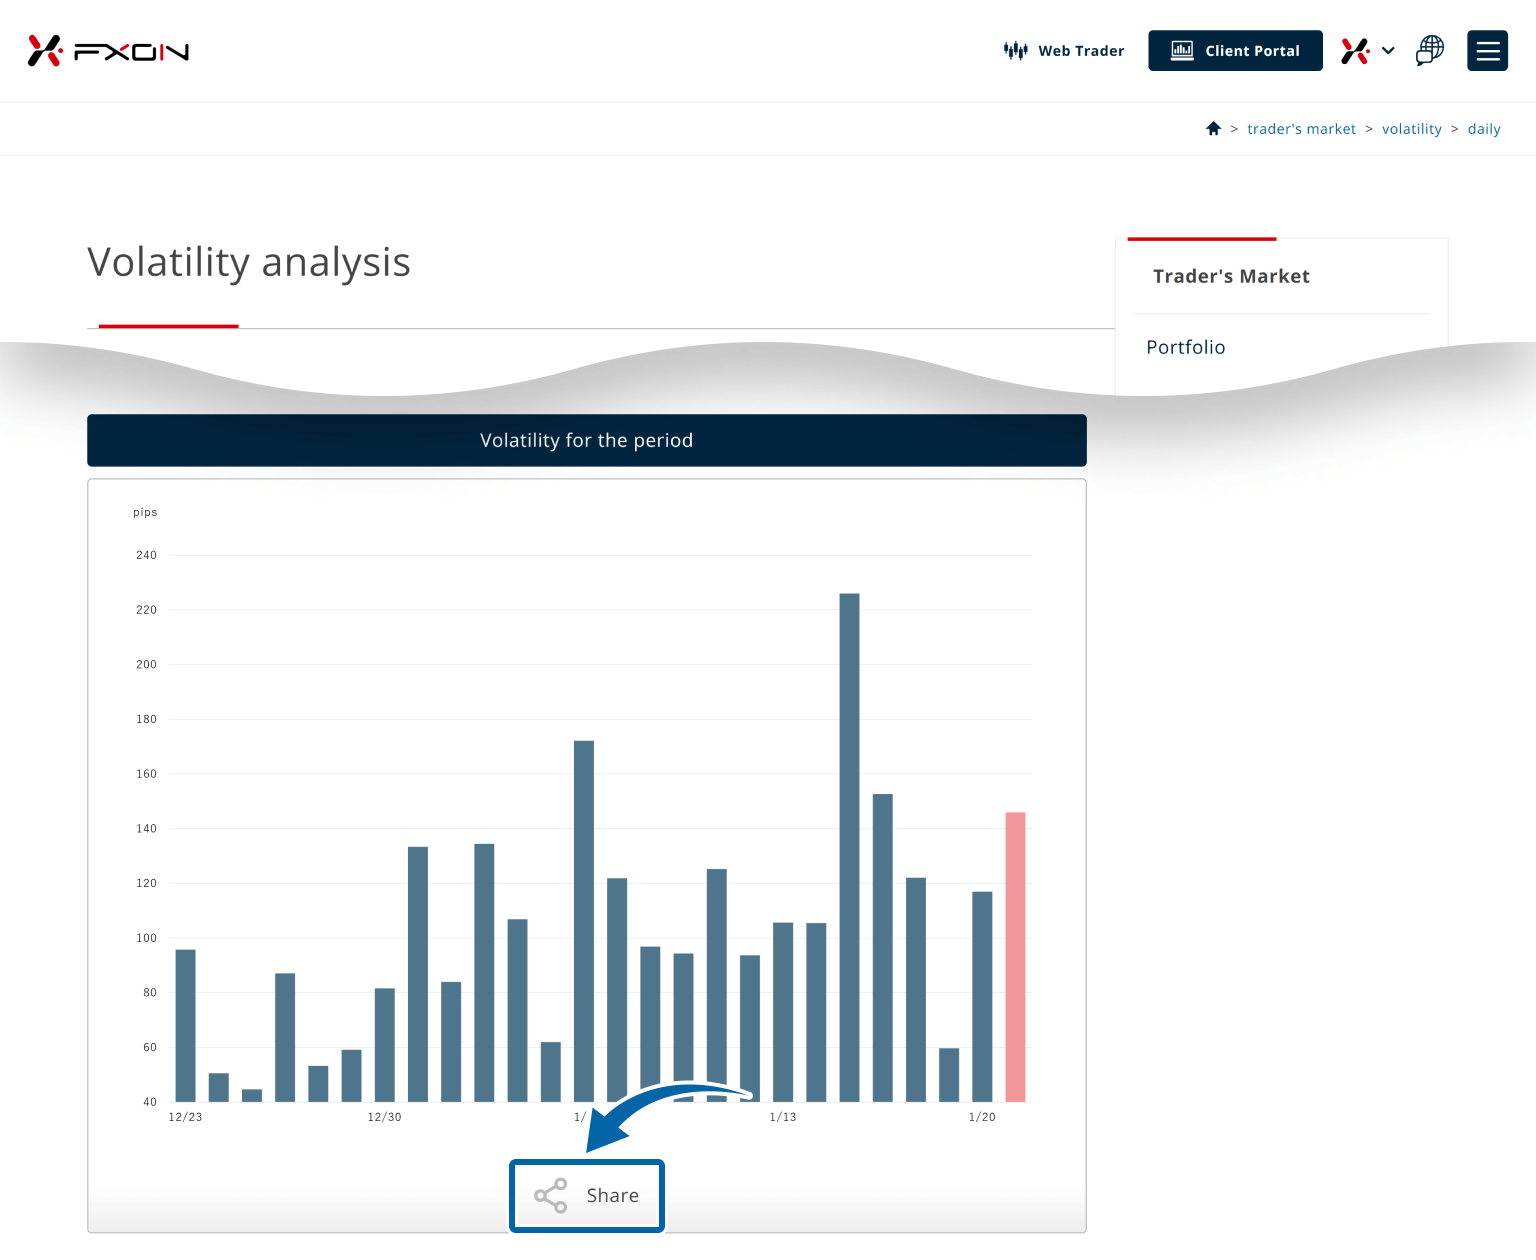
Review the volatility analysis content you wish to share and click the "Share" button below the graph.
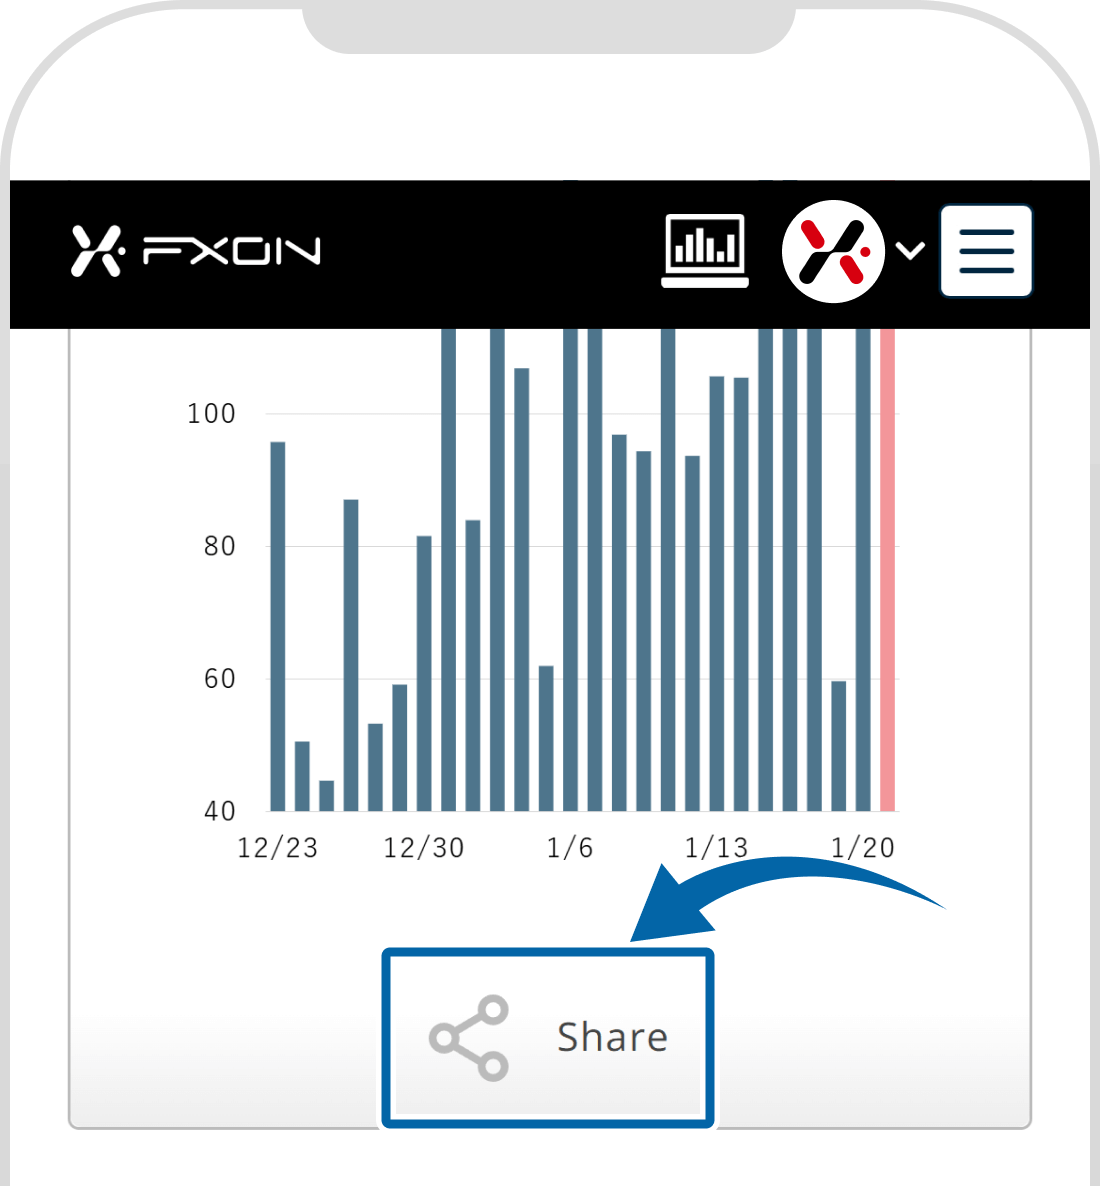
Review the volatility analysis content you wish to share and tap the "Share" button below the graph.
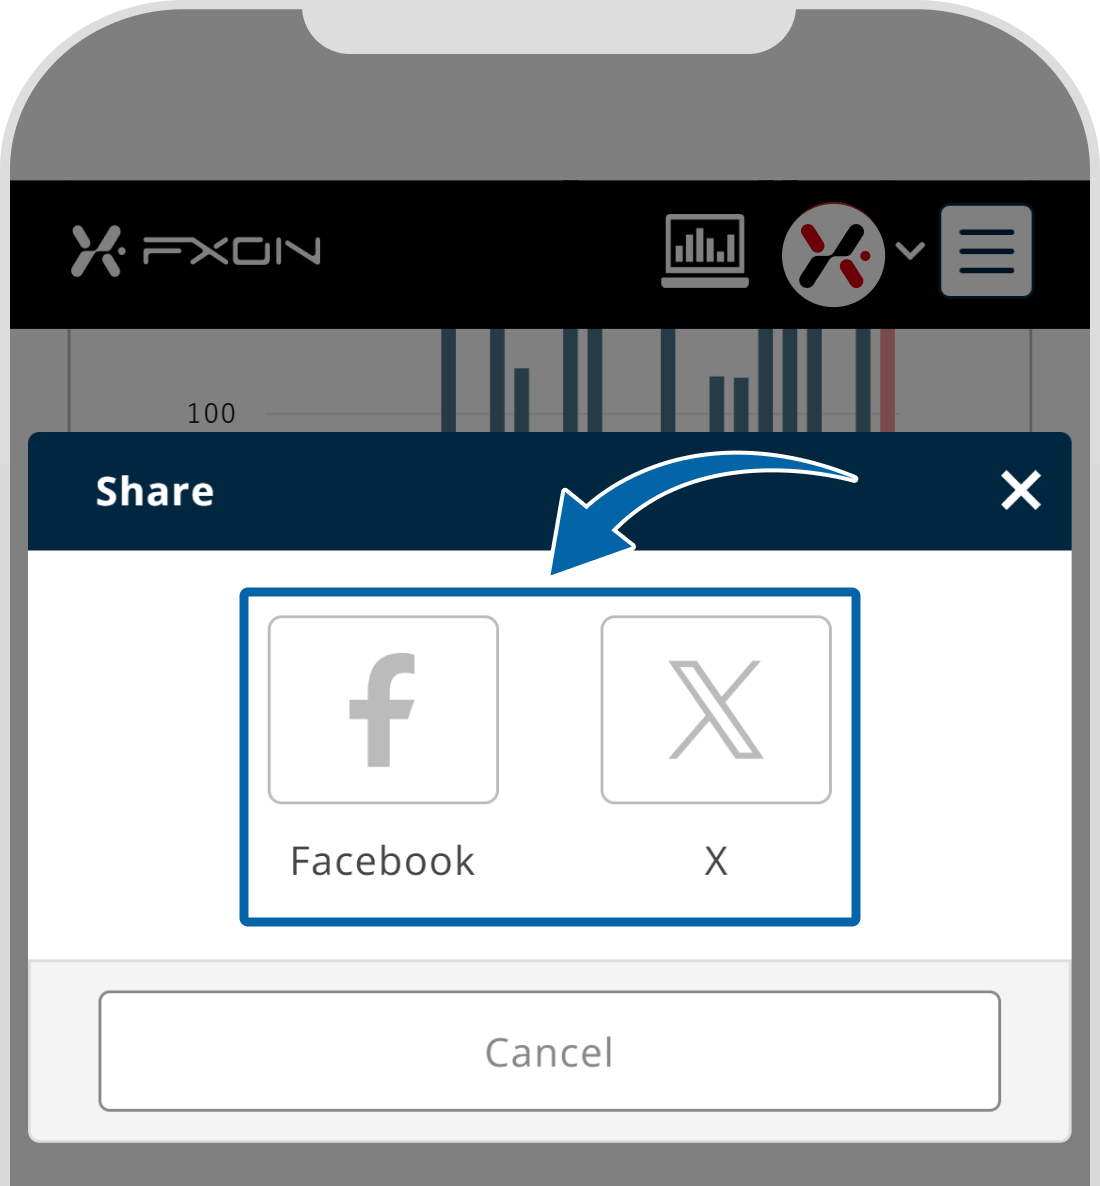
(1) Select the background color, then (2) choose the social media icon you want to share on.
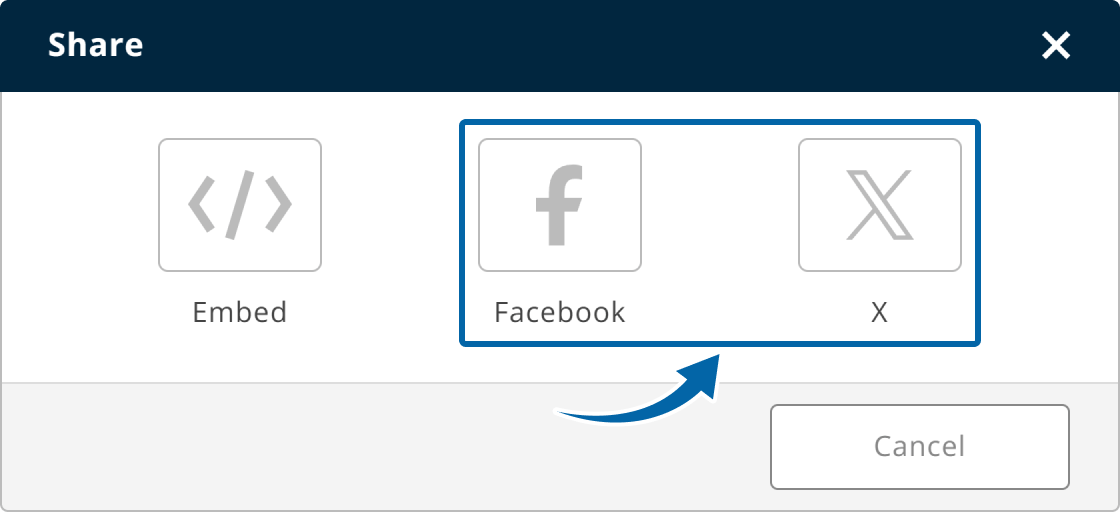
In addition to sharing on SNS, if you wish to post it on a blog, select "Embed" to generate a dedicated code. For instructions on generating the source embed code, please refer to the page below.
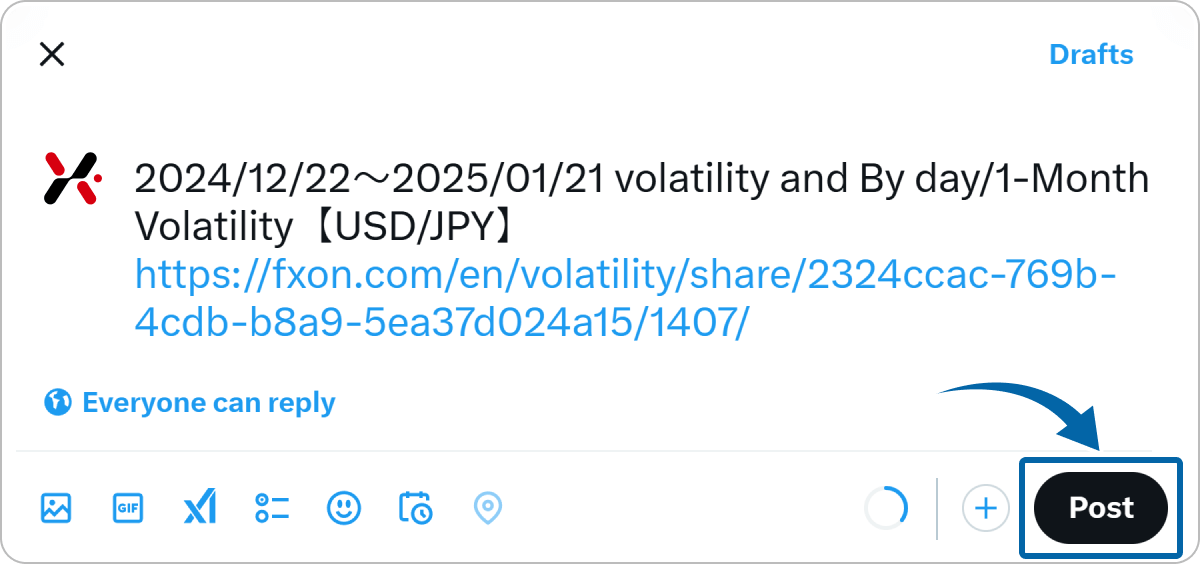
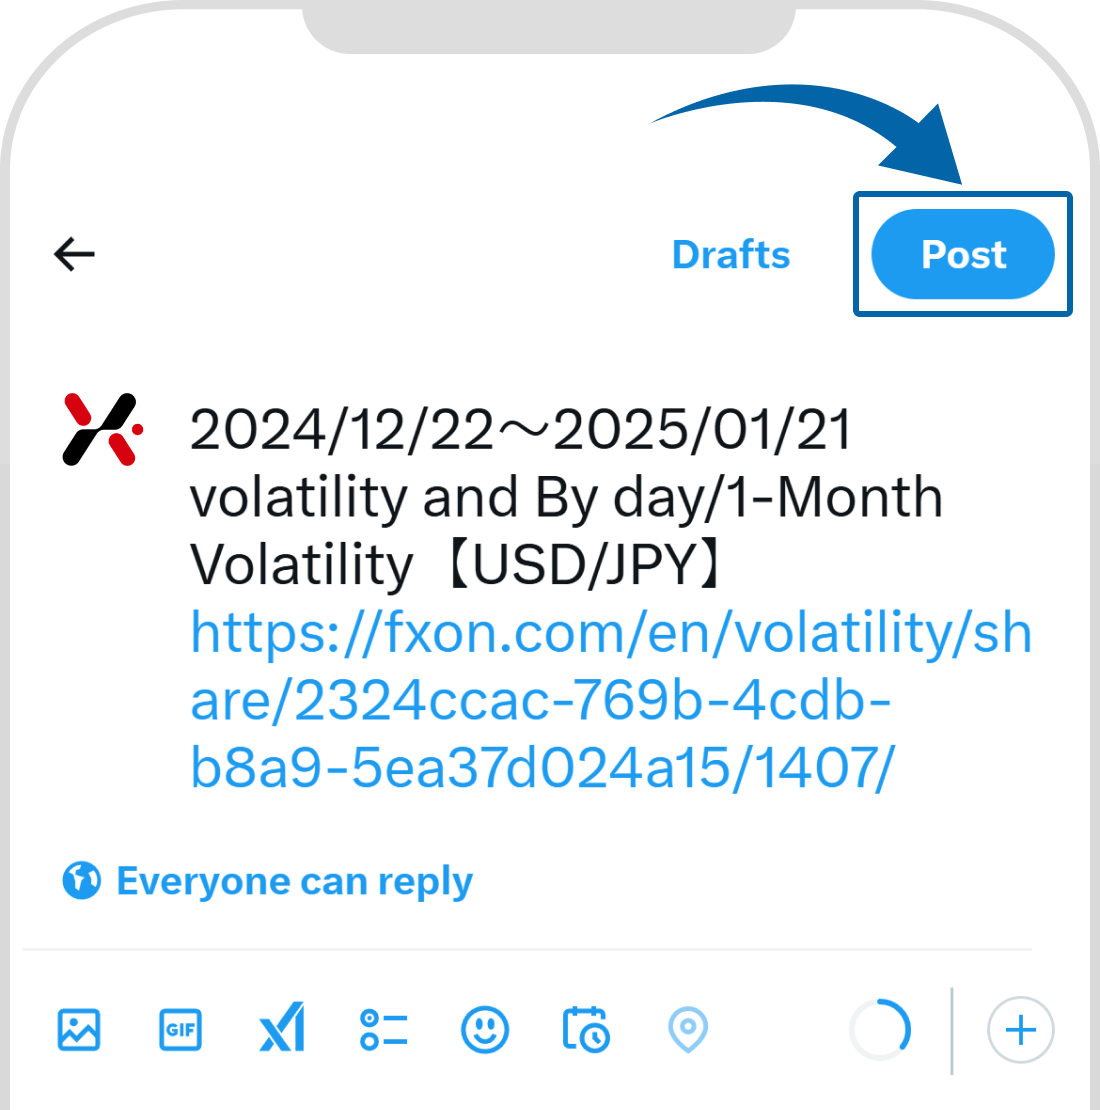
You will be redirected to each social media platform, where a share (post) screen with the link to the volatility analysis will appear. You can optionally add text or images, and once you click the register button on each social media platform, it will be shared.
You will be redirected to each social media platform, where a share (post) screen with the link to the volatility analysis will appear. You can optionally add text or images, and once you tap the register button on each social media platform, it will be shared.
Was this article helpful?
That’s Great!
Thank you for your feedback
Sorry! We couldn't be helpful
Thank you for your feedback
Feedback sent
We appreciate your effort and will try to fix the article
0 out of 0 people found this article helpful.
2025.01.20
How do I share my affiliate link on social media sites?
2025.01.15
How do I share the volatility analysis on social media?
2025.01.16
How can I share portfolios on social media?
2025.01.15
How can I share the volatility analysis on my blog?